the Creative Commons Attribution 4.0 License.
the Creative Commons Attribution 4.0 License.
 | 29 Jan 2020
Crystal chemistry of fluorcarletonite, a new mineral from the Murun alkaline complex (Russia)
Ekaterina Kaneva
Tatiana Radomskaya
Ludmila Suvorova
Irina Sterkhova
Mikhail Mitichkin
This paper reports the first description of the crystal structure and crystal chemical features of fluorcarletonite, a new mineral from the Murun potassium alkaline complex (Russia), obtained by means of single-crystal and powder X-ray diffraction (XRD), electron microprobe analysis (EMPA), thermogravimetry (TG), differential scanning calorimetry (DSC), and Fourier transform infrared (FTIR) spectroscopy. The crystal structure of fluorcarletonite, KNa4Ca4Si8O18(CO3)4(F,OH)• H2O, a rare phyllosilicate mineral, contains infinite double-silicate layers composed of interconnected four- and eight-membered rings of SiO4 tetrahedra and connected through the interlayer K-, Na- and Ca-centered polyhedra and CO3 triangles. The X-ray diffraction analysis confirms the mineral to be tetragonal, P4∕mbm, a=13.219(1) Å, c=16.707(2) Å, V=2919.4(6) Å3 (powder XRD data), a=13.1808(5) Å, c=16.6980(8) Å, V=2901.0(3) Å3 (single-crystal XRD data, 100 K). The EMPA (average from 10 analyses) gave the following composition (wt %): SiO2 44.1(6), CaO 20.0(3), Na2O 11.1(3), K2O 4.5(2), F 1.3(5), TiO2 0.1(1) and Al2O3 0.03(3). The TG–DSC analysis confirmed the presence of H2O and CO2 (weight losses of 1.17 % and 14.9 %, respectively). The FTIR spectrum acquired in the range from 4000 to 400 cm−1 reveals the presence of H2O, CO3 and OH groups. The average formula of fluorcarletonite calculated from the results of EMPA and crystal structure refinement is K1.04Na3.89Ca3.87Ti0.01Si7.99Al0.01O18(CO3)3.86(F0.72OH0.28)•1.11H2O.
- Article
(5571 KB) -
Supplement
(698 KB) - BibTeX
- EndNote


Fluorcarletonite, idealized KNa4Ca4Si8O18(CO3)4F• H2O, is the rare mineral belonging to the group of phyllosilicates. The crystal structure contains infinite branched sechser double-silicate layers (Liebau, 2012) composed of interconnected four- and eight-membered rings of SiO4 tetrahedra and connected through the sheets of interlayer K-, Na- and Ca-centered polyhedra and CO3 triangles. Fluorcarletonite is an F analogue of carletonite, discovered in 1971 by Chao and named after the Carleton University (Chao, 1971). The reported formula of carletonite, KNa4Ca4Si8O18(CO3)4(F,OH)• H2O, is inconsistent with the formula given in the mineral description (Chao, 1971) and obtained by the single-crystal X-ray diffraction (SCXRD) investigation of the mineral (Chao, 1972). The chemical composition, K0.74Na3.56(Ca3.74Mg0.03)Σ3.77(Si7.89Al0.11)Σ8.00O18 (CO3)3.65F0.41•2.05H2O, and the occupancy of the “F” site, F0.41(OH)0.59 where OH > F, were represented by Chao (1971, 1972). Indeed, in Chao (1972), it is reported that the ideal chemical formula of carletonite should be written as KNa4Ca4Si8O18(CO3)4(OH,F)• H2O, or KNa4Ca4Si8O18(CO3)4(OH,F)• H2O1+x with x=0–1.0, if the excess water is included. The only known world occurrence of carletonite is the Poudrette quarry, Mont Saint-Hilaire, Canada. The mineral was recognized and described in the specimens acquired from the marble xenoliths as well as from hornfels (Chao, 1971). Carletonite occurs either in pink to pale-blue prismatic crystals, in places up to 6 cm long, or as massive aggregates. At present it is almost impossible to find collectible specimens of carletonite in the Poudrette quarry, and prospects for the future are not promising, since the most interesting area, where the mineral has been found, was removed and allowed to flood (Pohwat and Cook, 2016).
This paper provides the first description of the crystal chemical features of fluorcarletonite from the Murun massif, Russia. The name “fluorcarletonite” denotes the compositional relation between fluorcarletonite (Murun), idealized KNa4Ca4Si8O18(CO3)4F• H2O, and carletonite (Mont Saint-Hilaire), idealized KNa4Ca4Si8O18(CO3)4(OH)• H2O. The new mineral species and its name have been approved by the Commission on New Minerals and Mineral Names of the International Mineralogical Association (IMA no. 2019-038). The holotype specimen has been deposited at the Sidorov State Mineralogical Museum of Irkutsk National Research Technical University (catalogue no. 12/1764).
The fluorcarletonite sample under study was found in charoitites (dominantly charoite-bearing rocks) of the Severny district at the Malyy Murun syenite massif located in the NW Aldan Shield, Siberia, Russia ( N E). The ultra-agpaitic alkaline Murun complex covering the area of ∼150 km2 represents the largest formation of alkaline rocks showing potassium enrichment and consisting of the Bolshoy Murun and Malyy Murun massifs. Nepheline, alkaline and quartz syenites of the Bolshoy Murun massif occur in the west of the complex, whereas the eastern part hosts the ultra-potassic rocks of the Malyy Murun massif (Vladykin, 2016). The Malyy Murun age was estimated by K–Ar method as Early Cretaceous (131.3±2.4 Ma) (Wang et al., 2014). About 100 minerals were found in both massifs, with some of them being rare or new.
Optical petrographic and mineragraphic studies were carried out in transmitted and reflected light using a polarized microscope, OLYMPUS BX 51.
Seventeen minerals were identified by studying polished samples and thin sections: fluorcarletonite, aegirine, fluorapatite, microcline, pectolite, fluorapophyllite-(K), charoite, quartz, calcite, baryte, wollastonite, galena, idaite, chalcocite, digenite, native copper and covellite. Considering the mineral content, the rock (Fig. 1) might be referred to as an aegirine- and fluorcarletonite-containing apophyllite–pectolite–charoitite.
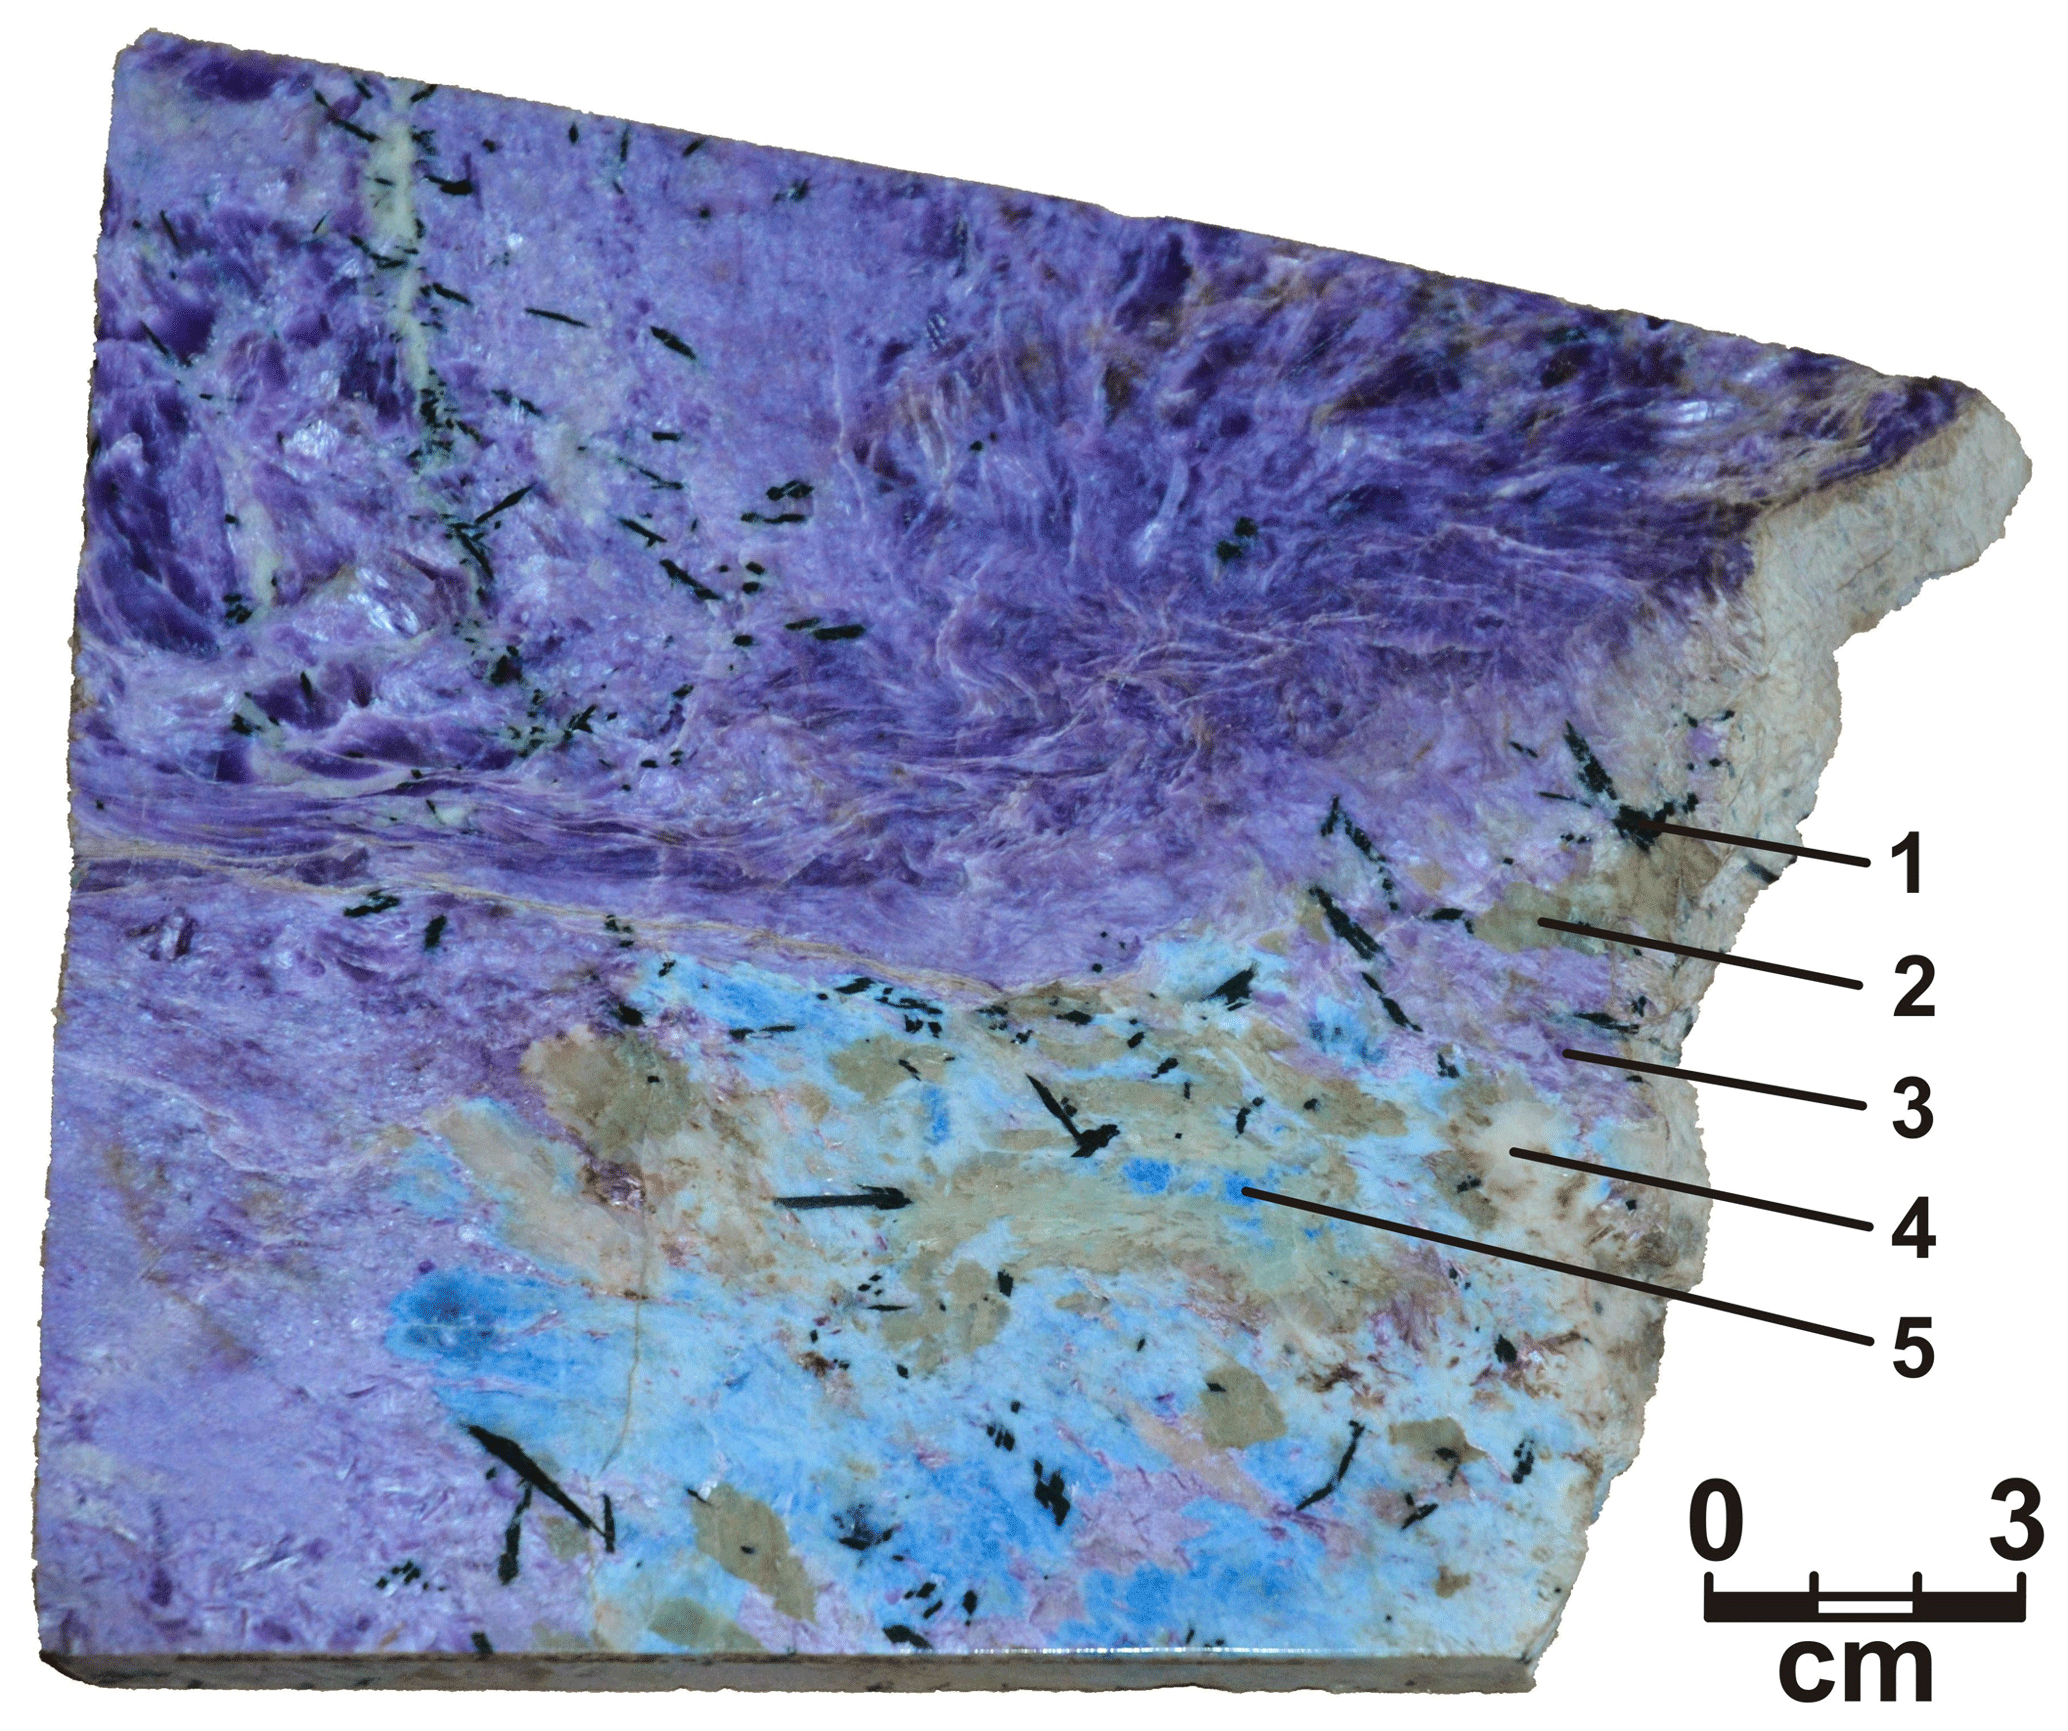
Figure 1Fluorcarletonite-containing charoitite. The specimen is deposited at the Sidorov State Mineralogical Museum (Irkutsk, Russia). 1 – aegirine, 2 – pectolite, 3 – charoite, 4 – apophyllite-(KF), 5 – fluorcarletonite.
Fluorcarletonite largely crystallizes as unevenly distributed allotriomorphic grains reaching 0.5×0.7–0.3×0.5 cm in size and forming single mineral aggregates of 0.7×1.5 cm in size. Visually, the color of the mineral is light blue to blue; in thin sections, the mineral is colorless. Fluorcarletonite might contain numerous inclusions of small prismatic hypidiomorphic grains of apatite up to 0.05 mm in size in cross section and from 0.05 to 0.2 mm in size in longitudinal section as well as rarer idiomorphic crystals of aegirine up to 0.1 mm in size in cross section and from 0.6 to 1.0 mm in size in longitudinal section. Fluorcarletonite forms close intergrowths with fluorapophyllite-(K) and pectolite, and it is associated with charoite.
Fluorcarletonite is brittle with perfect cleavage on {001} and good parting on {110}, and it has a conchoidal fracture. Calculated density from the empirical formula is Dcalc=2.491 g cm−3. The mineral has a Mohs hardness of 4–4.5. It is uniaxial (–) with ω=1.520(3) and ε=1.515(3).
3.1 Chemical analyses
To determine the chemical compositions of fluorcarletonite and associated minerals, a JEOL JXA-8200 electron microprobe was employed. It is equipped with a high-resolution scanning electron microscope, an energy-dispersive spectrometer with the Si(Li) detector (resolution – 133 eV) and five wavelength-dispersive spectrometers (WDSs).
The analyzed sample was a polished section of a charoitite rock. The sample images in back-scattered electrons obtained by scanning over the area showed that it consists of small intergrowths of several minerals that were WDS-diagnosed.
The conditions for the excitation and recording of analytical signals were as follows: accelerating voltage =20 kV; probe current =2 nA; beam diameter =10–20 µm, depending on the analyzed object; counting time on peak =10 s; and counting time on background =5 s. The following standards were used: albite (Na, Al), diopside (Mg, Ca, Si), ilmenite (Ti), pyrope (Fe), orthoclase (K), apatite (Cl, P) and F-apatite (F). A conversion from X-ray counts to oxide weight percentages was obtained with the ZAF data reduction system (ZAF correction is combination of corrections for atomic number effect (Z), for absorption (A), and for fluorescence phenomena (F)).
Table 1 offers the average compositions of some areas of the studied sample compared with carletonite (Chao, 1971). The H2O and CO2 contents were determined and/or confirmed by the TG–DSC, FTIR and SCXRD investigations (see below).
Table 1Average composition (wt %) and atomic proportion (apfu) calculated on the basis of 8(Si+Al) for the studied fluorcarletonite compared with carletonite from the Mont Saint-Hilaire massif, obtained by wet-chemical analysis (Chao, 1971).
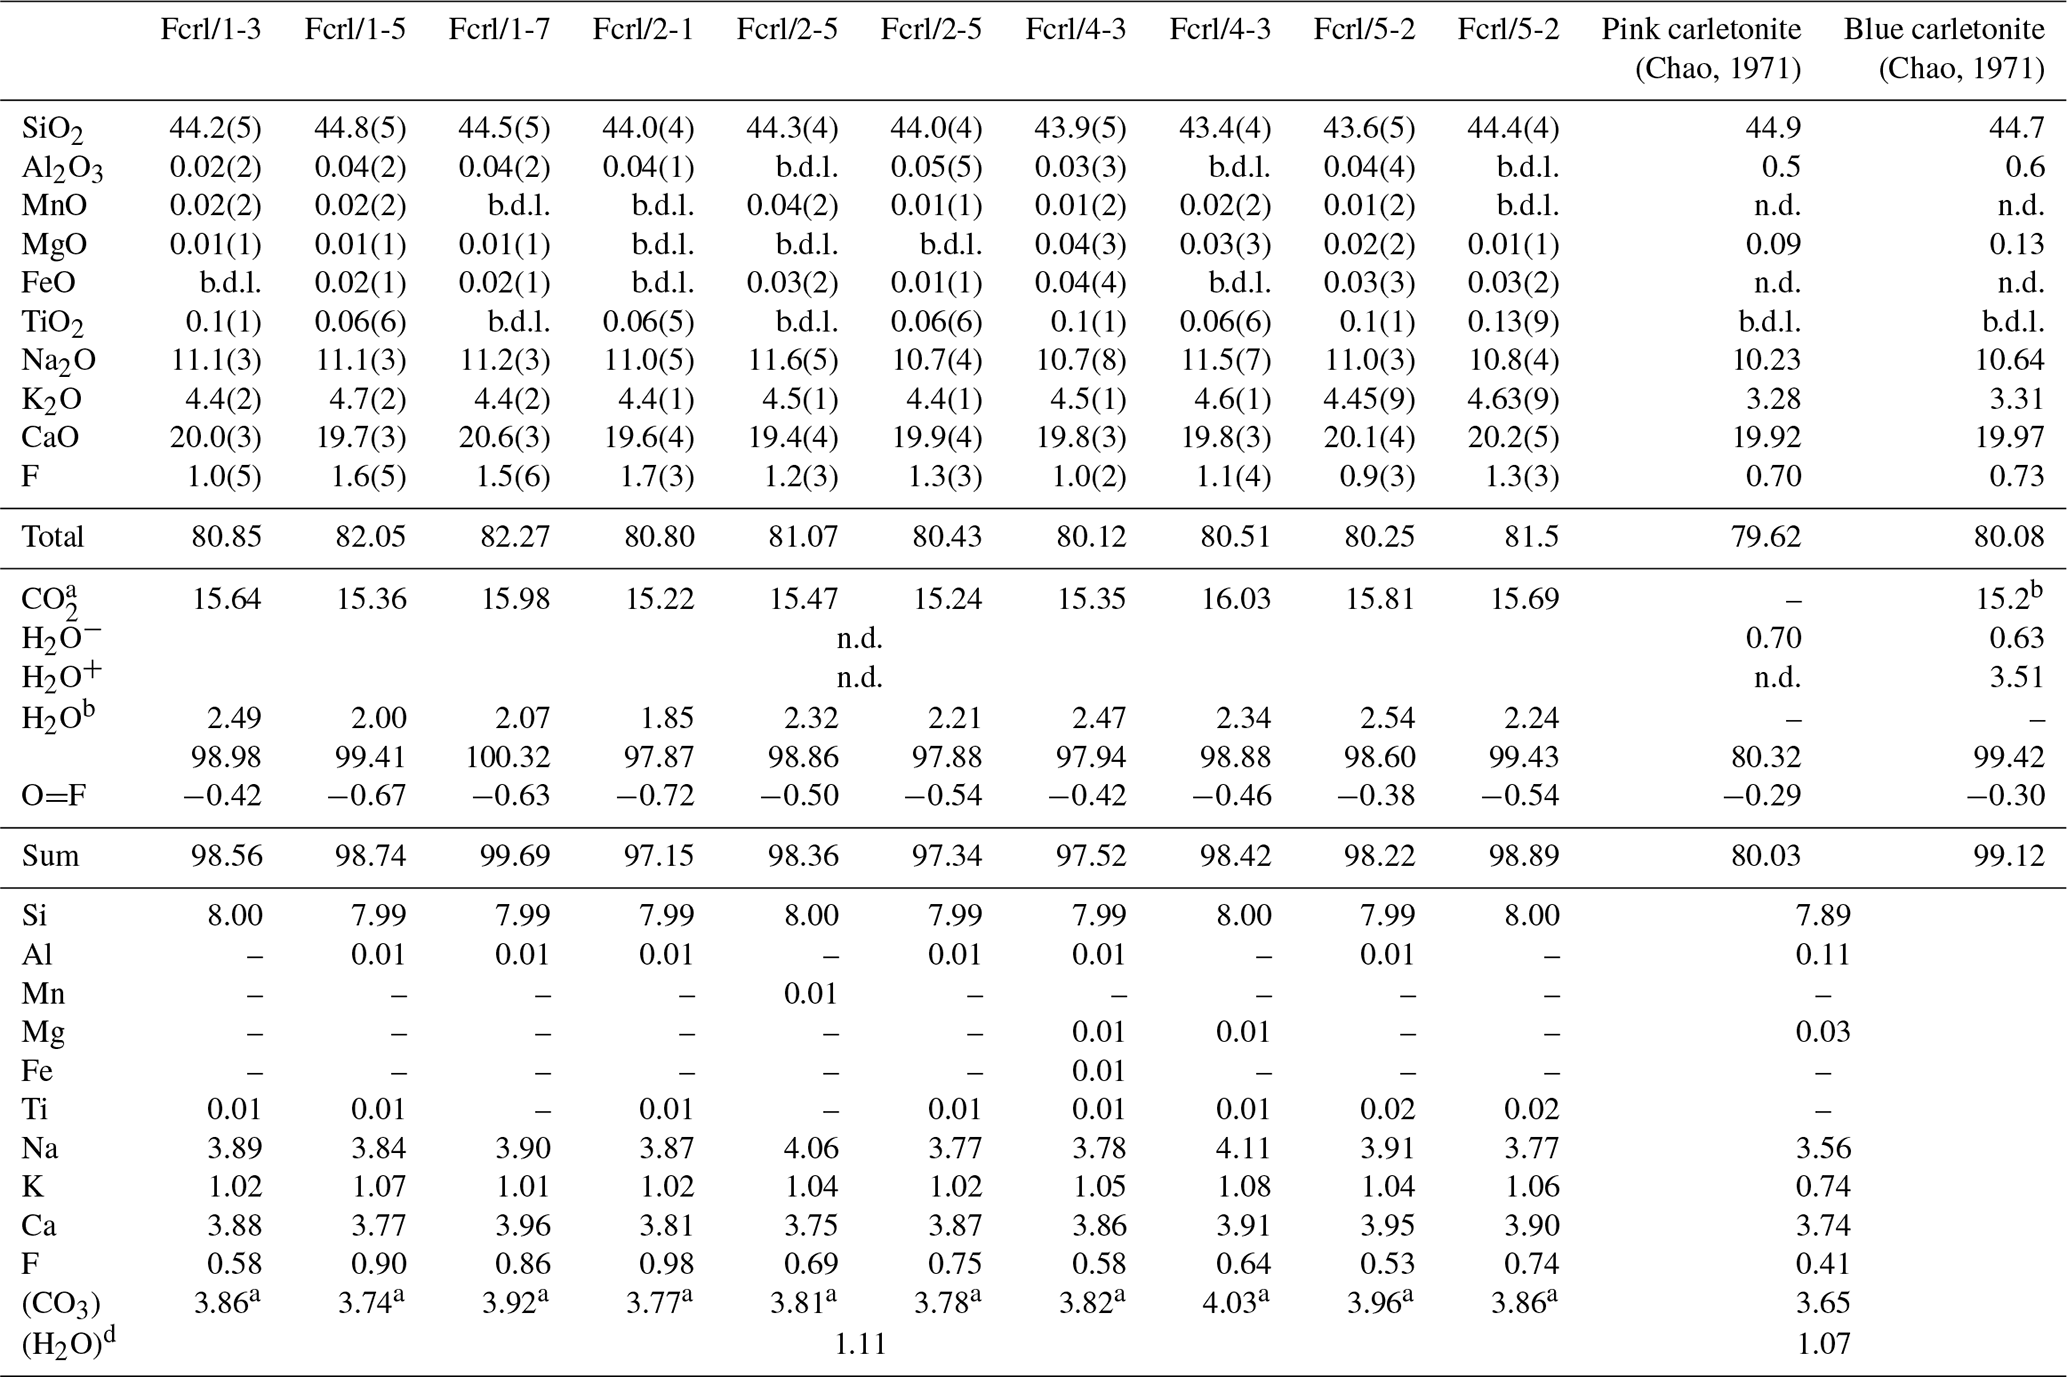
Fcrl is the sample name and the digit is the sample area code. b.d.l. – below detection limit; n.d. – not determined. a Calculated
according to the principle of electroneutrality
of the chemical formula.
b Determined by an acid evolution-gravimetric method (Chao, 1971). c Calculated using a single-crystal X-ray diffraction data refinement.
d Determined by a single-crystal X-ray diffraction data refinement.
3.2 X-ray diffraction study
The powder X-ray diffraction data of the mineral were collected using a Bruker D8 ADVANCE diffractometer equipped with a Göbel mirror and scintillation detector with radial Soller slits on the diffraction beam. Data were recorded in step scan mode in the range of diffraction angles 2θ from 5 to 80∘, using CuKα radiation. Experimental conditions were as follows: 40 kV, 40 mA, time per step – 1 s and step size – 0.02∘2θ. The unit-cell parameters of fluorcarletonite refined using TOPAS 4 (Bruker, 2008) are a=13.219(1) Å, c=16.707(2) Å, V=2919.4(6) Å3. The XRD pattern is similar to that obtained for carletonite by Chao (1971) (Table S1, Supplement S1, freely available online as a Supplement linked to this article).
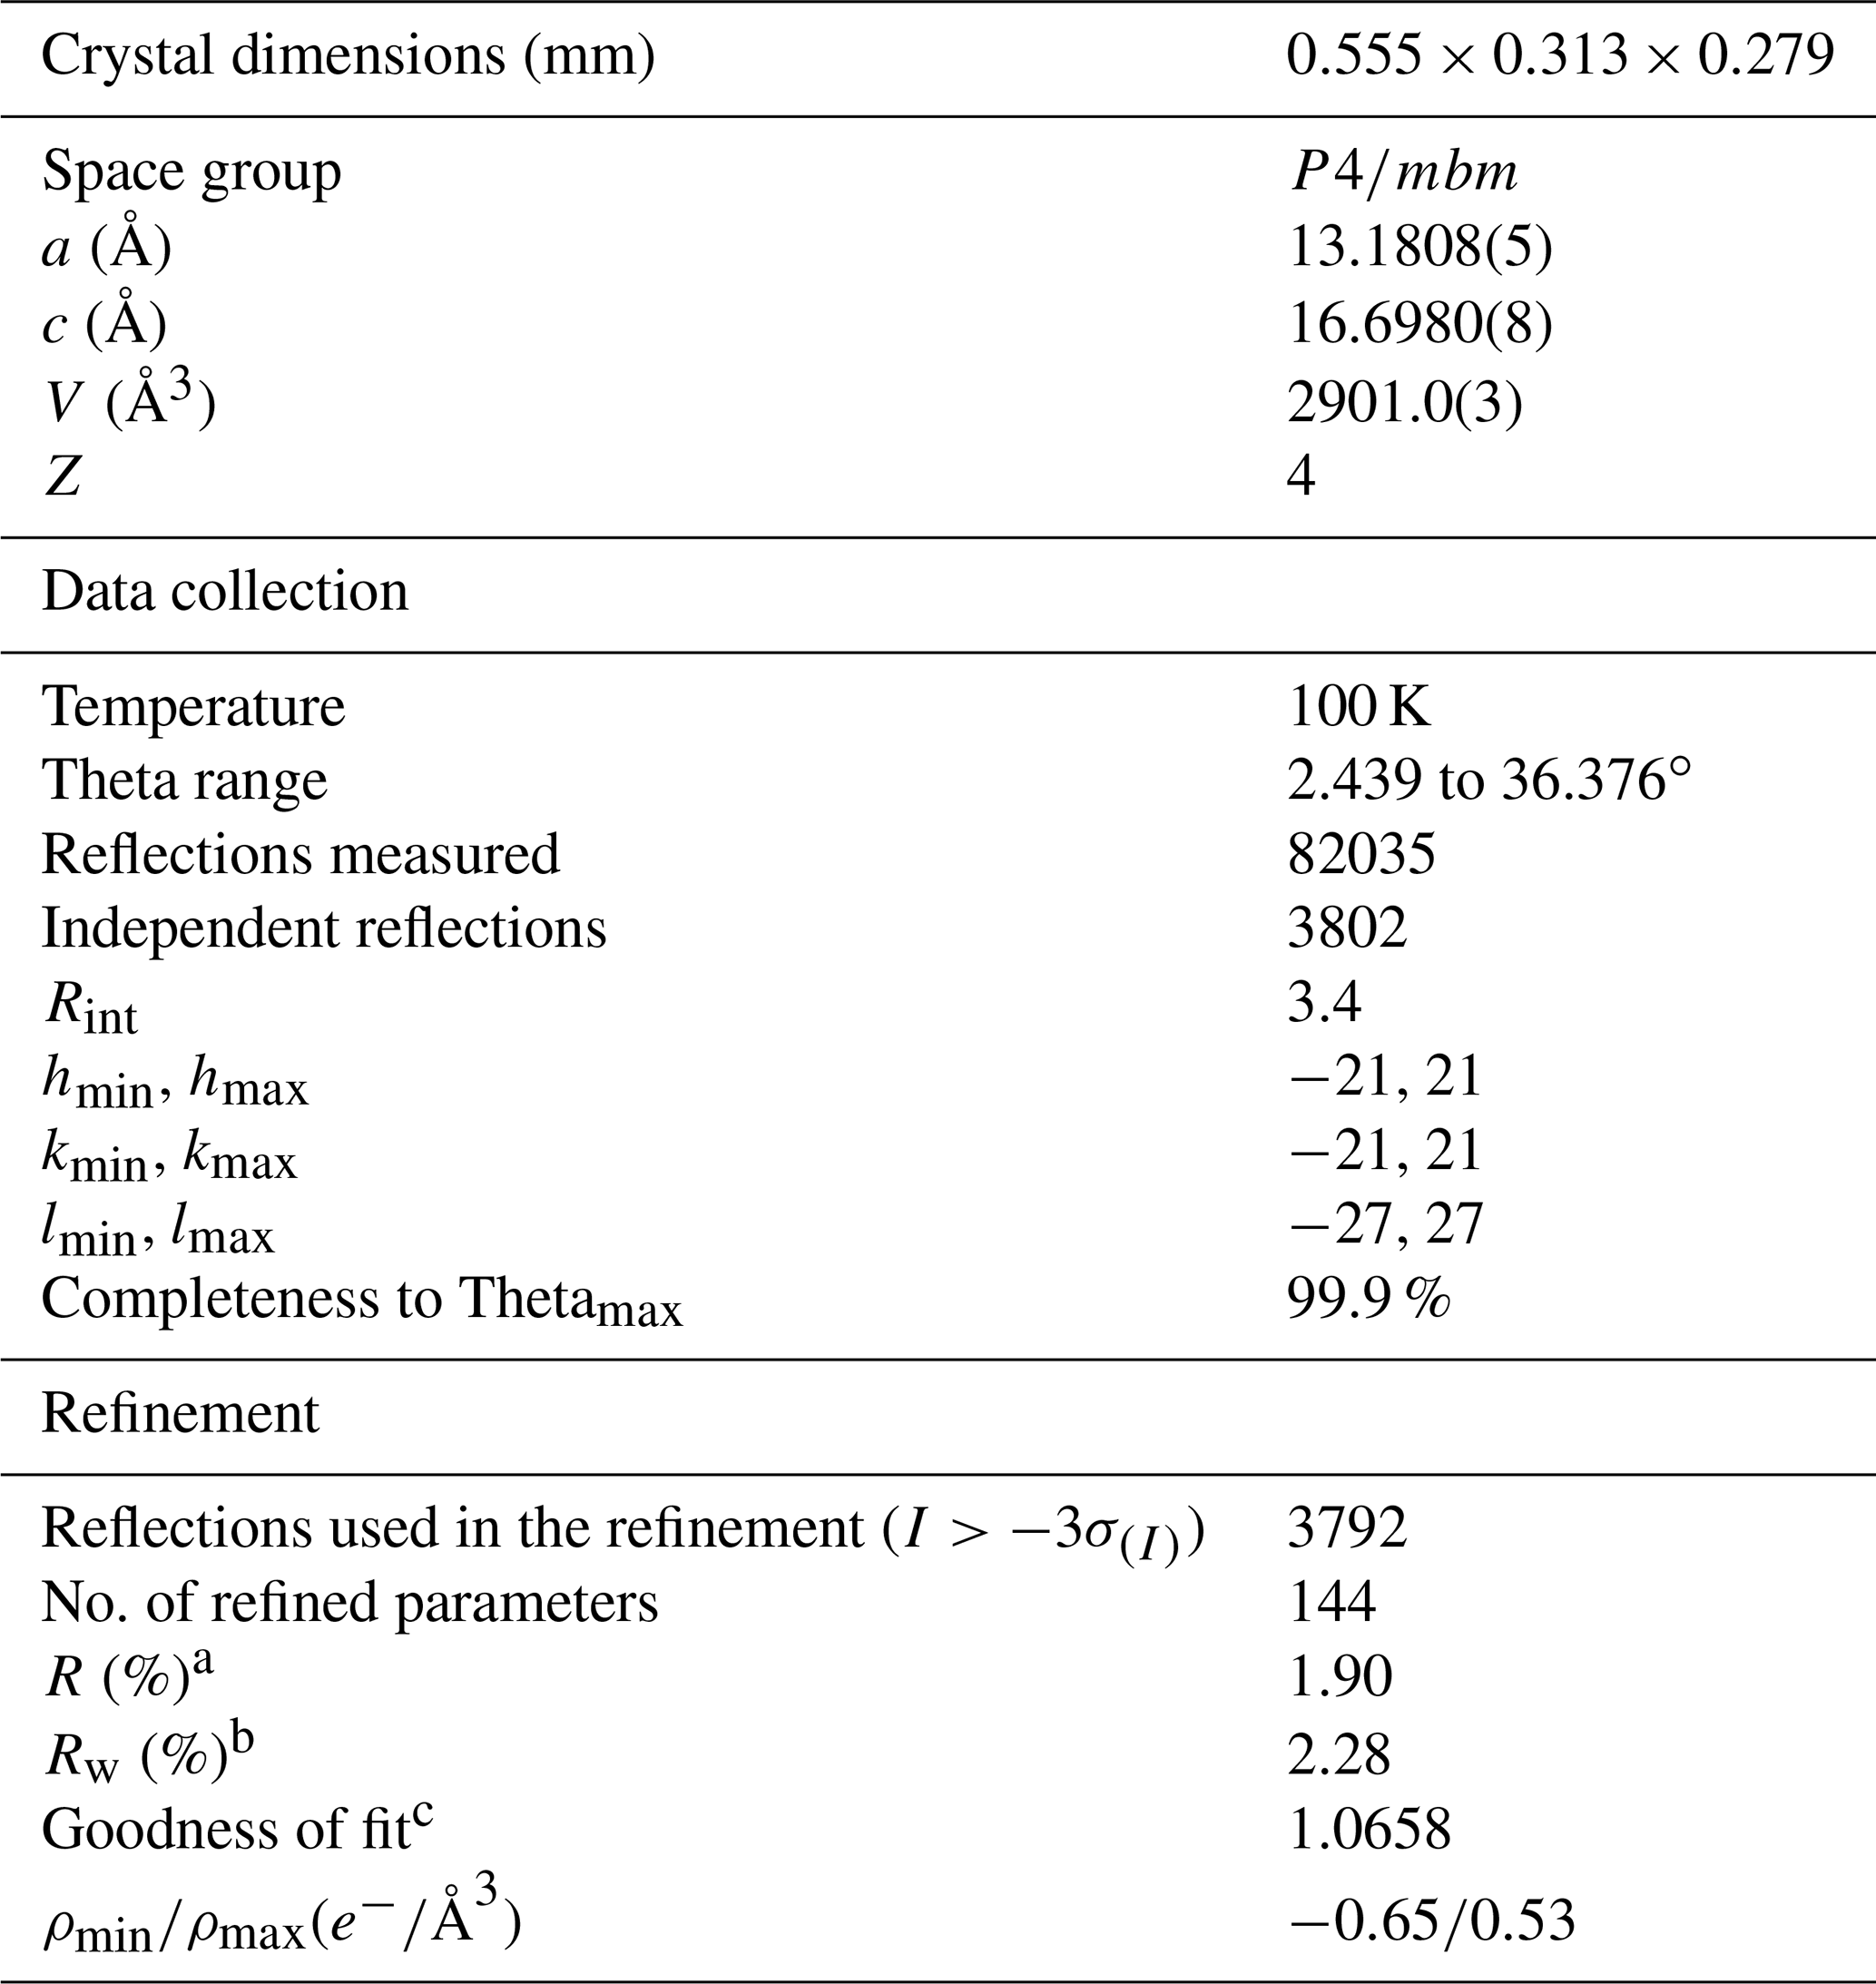
A fragment of blue fluorcarletonite single crystal was mounted on a Bruker AXS D8 VENTURE dual-source diffractometer with a Photon 100 detector under monochromatized MoKα radiation. Low-temperature (100 K) data collection was done using a Bruker Cobra nitrogen cryostat. Two sets of 12 frames were used for initial cell determination, whereas the entire Ewald sphere (±h, ±k, ±l) up to was recorded by a combination of several φ and ω rotation sets, with 0.5∘ scan width and 6 s exposure time per frame. Operating conditions were crystal-to-detector distance of 40 mm, 50 kV and 1 mA. The data collection strategy was optimized by the APEX2 program suite (Bruker, 2003) and the reflection intensities were extracted and corrected for Lorentz polarization by the SAINT package (Bruker, 2007). A semiempirical absorption correction was applied by means of the SADABS software (Bruker, 2009). The XPREP software assisted in the determination of the space group and in the calculation of the intensity statistics. Finally, least-squares refinement was performed using the program CRYSTALS (Betteridge et al., 2003). Information concerning the data collection and refinement is listed in Table 2. The refined parameters included scale factors, atom coordinates, atomic displacement parameters and occupancies (for alkaline and alkaline earth sites and O(w) positions). The initial atom coordinates for the structure refinement were taken from Chao (1972). The refinement converged to the R1 value of 1.90 % (wR=2.28 %). Final atomic coordinates and displacement parameters of fluorcarletonite sample are given in Table 3; selected interatomic bond distances and angles are listed in Tables S2 and S3, Supplement S1.
Table 2Selected data about the single crystal, the data-collection parameters and the structure refinement of fluorcarletonite.
.
; w=
Chebyshev optimized weights.
c Goodness of fit ,
where N and P are the number of reflections and parameters, respectively.
Table 3Crystallographic coordinates, occupancies, equivalent/isotropic (Å2) and anisotropic atomic displacement parameters (Å2) of fluorcarletonite.
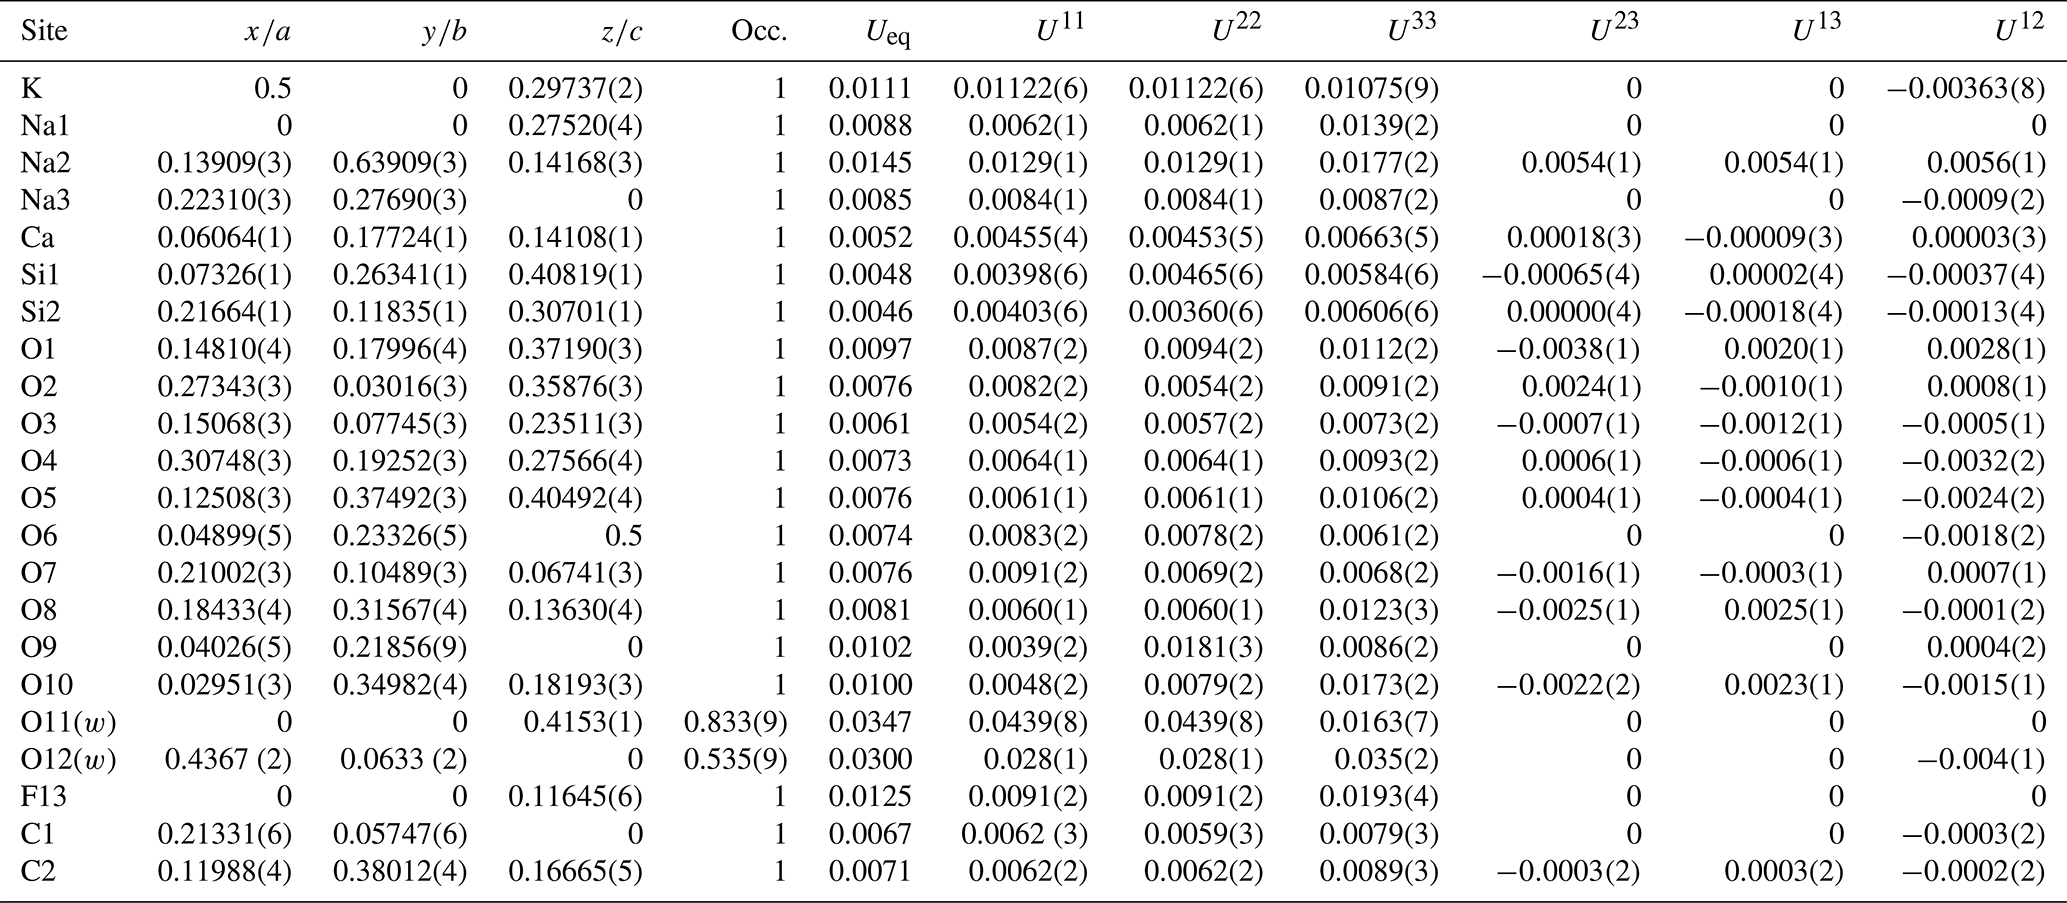
Table 4Selected distortion parameters for the studied fluorcarletonite compared to those calculated for carletonite using data from Chao (1972). Software for calculation – VESTA 3 (Momma and Izumi, 2011).
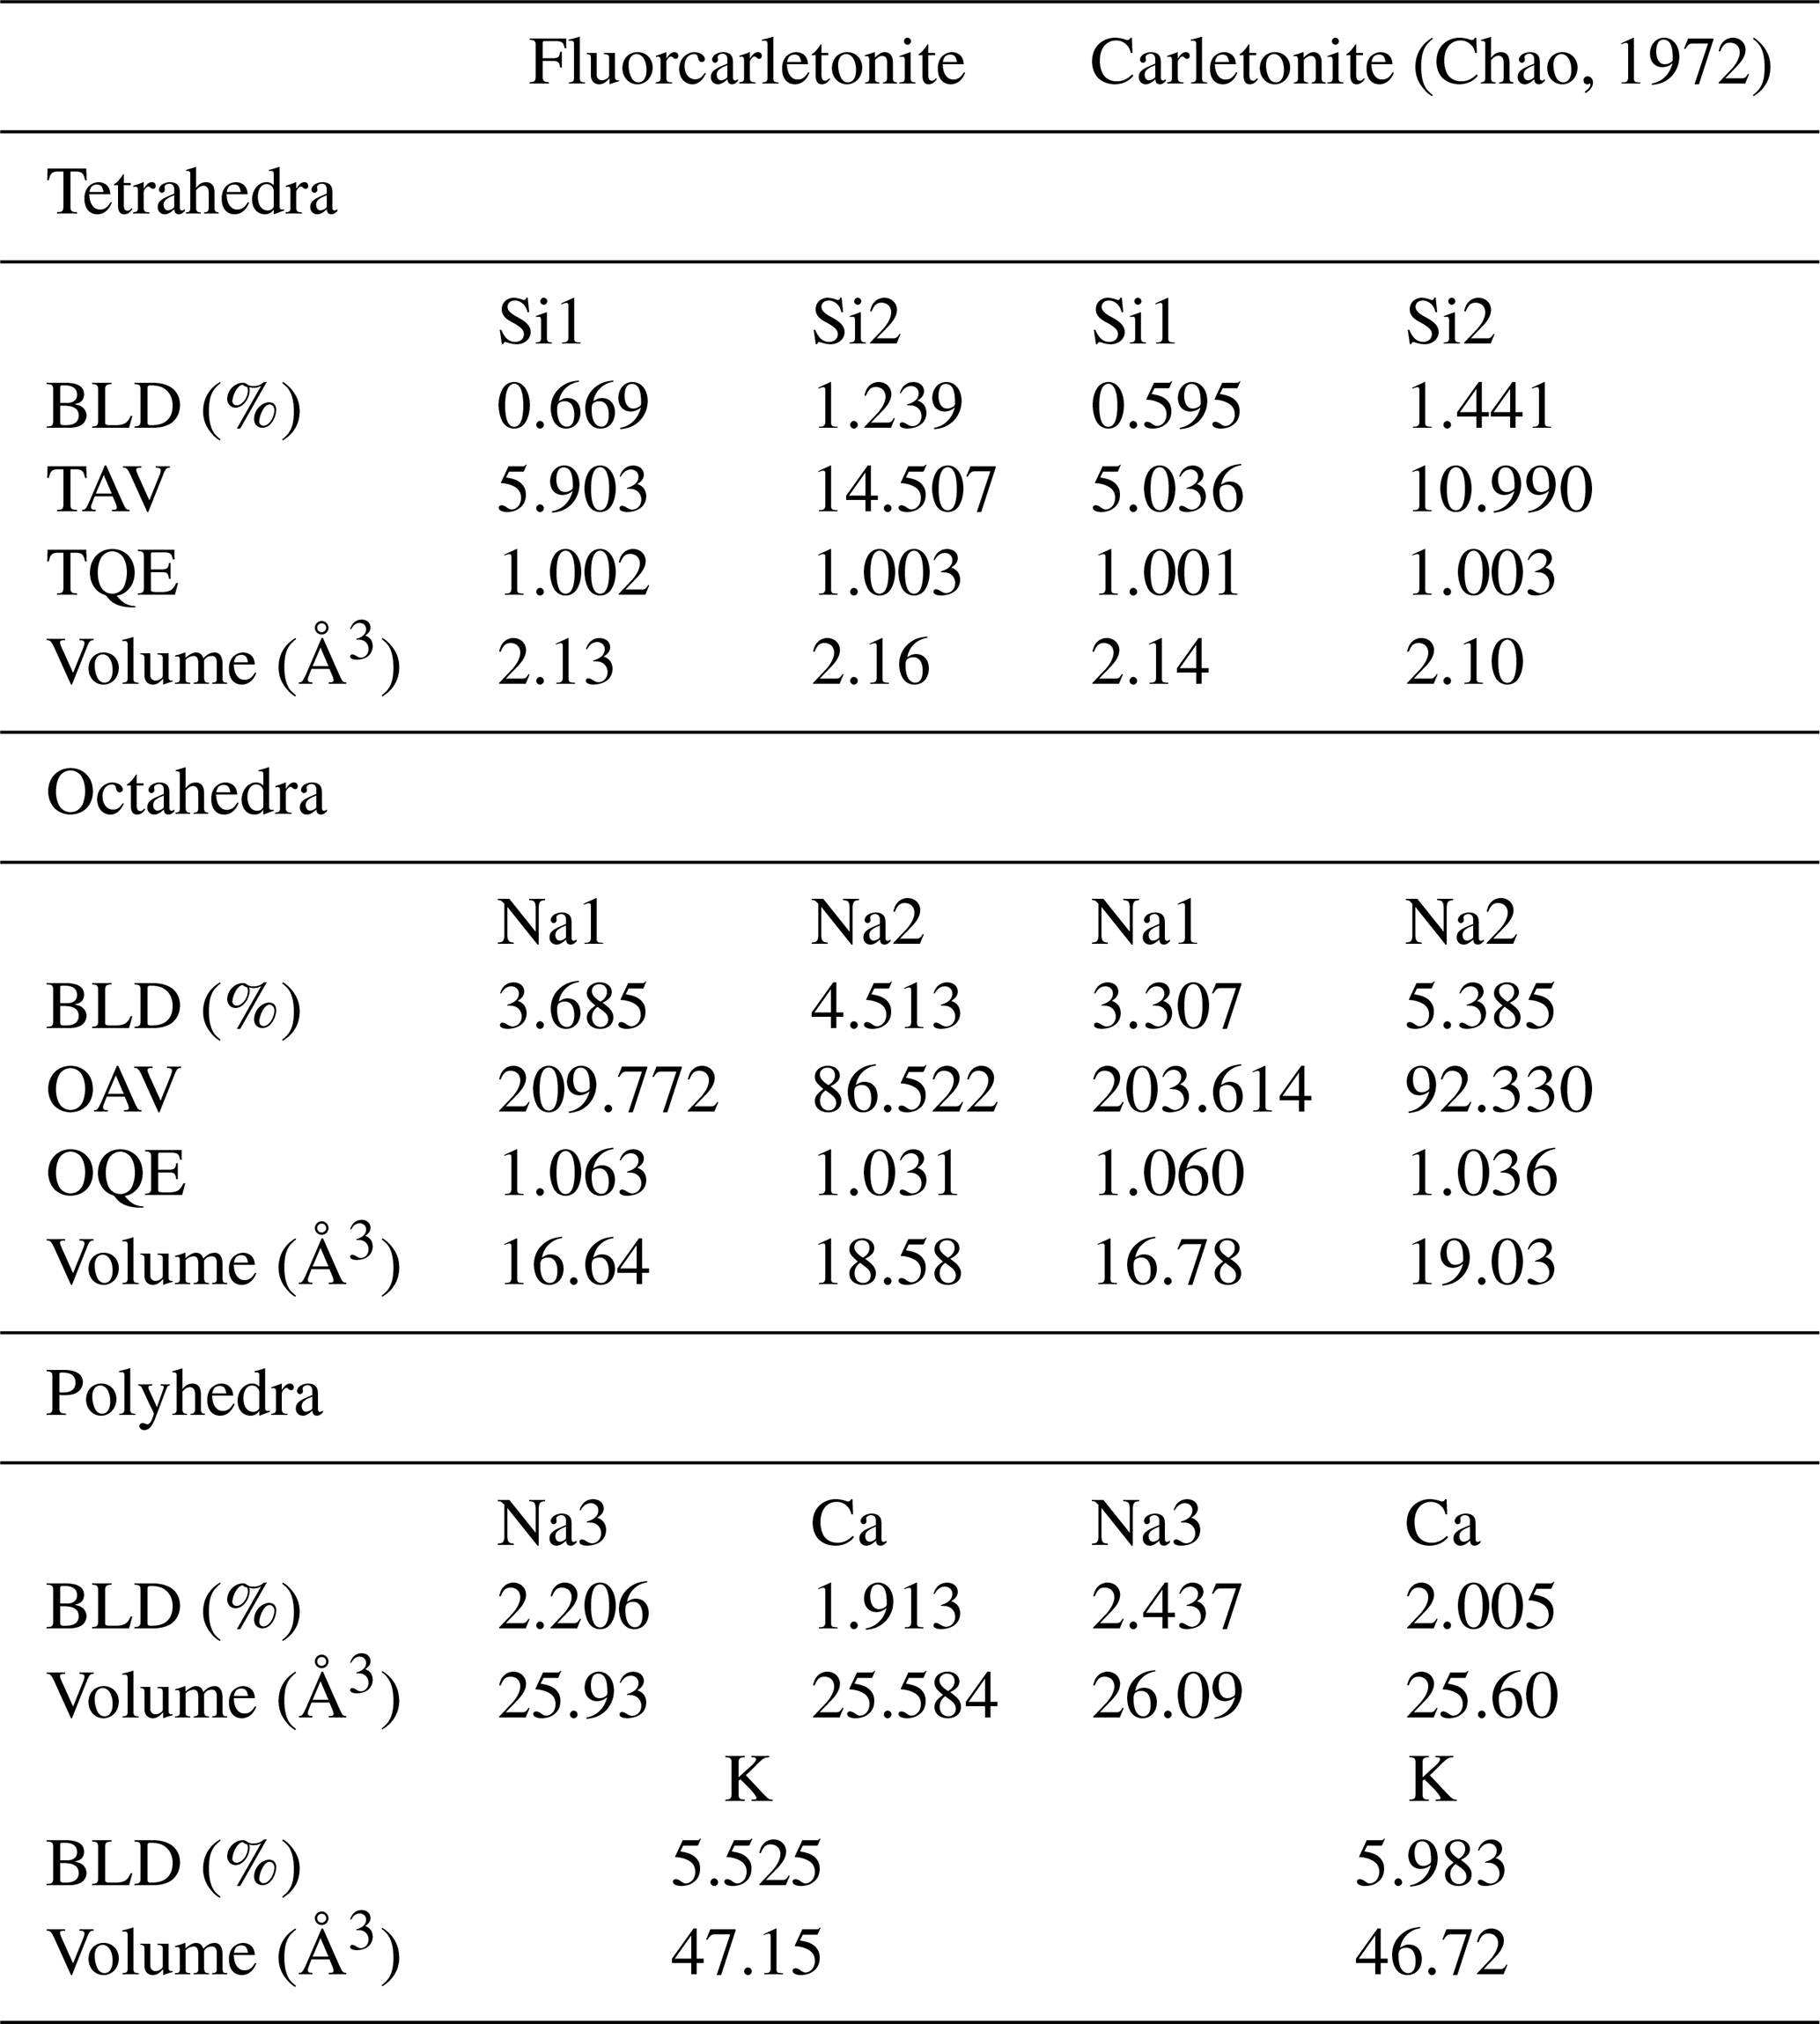
Note: BLD (bond length distortion) %, where n is the number of bonds and (X−O) the central cation–oxygen length (Renner and Lehmann, 1986); TAV (tetrahedral angle variance) (Robinson et al., 1971); TQE (tetrahedral quadratic elongation) , where I0 is the center to vertex distance for an undistorted tetrahedron whose volume is equal to that of the distorted tetrahedron with bond length Ii (Robinson et al., 1971); OAV (octahedral angle variance) (Robinson et al., 1971); OQE (octahedral quadratic elongation) , where I0 is the center to vertex distance for an undistorted octahedron whose volume is equal to that of the distorted octahedron with bond length Ii (Robinson et al., 1971).
Table 5Bond-valence sum for the studied fluorcarletonite.
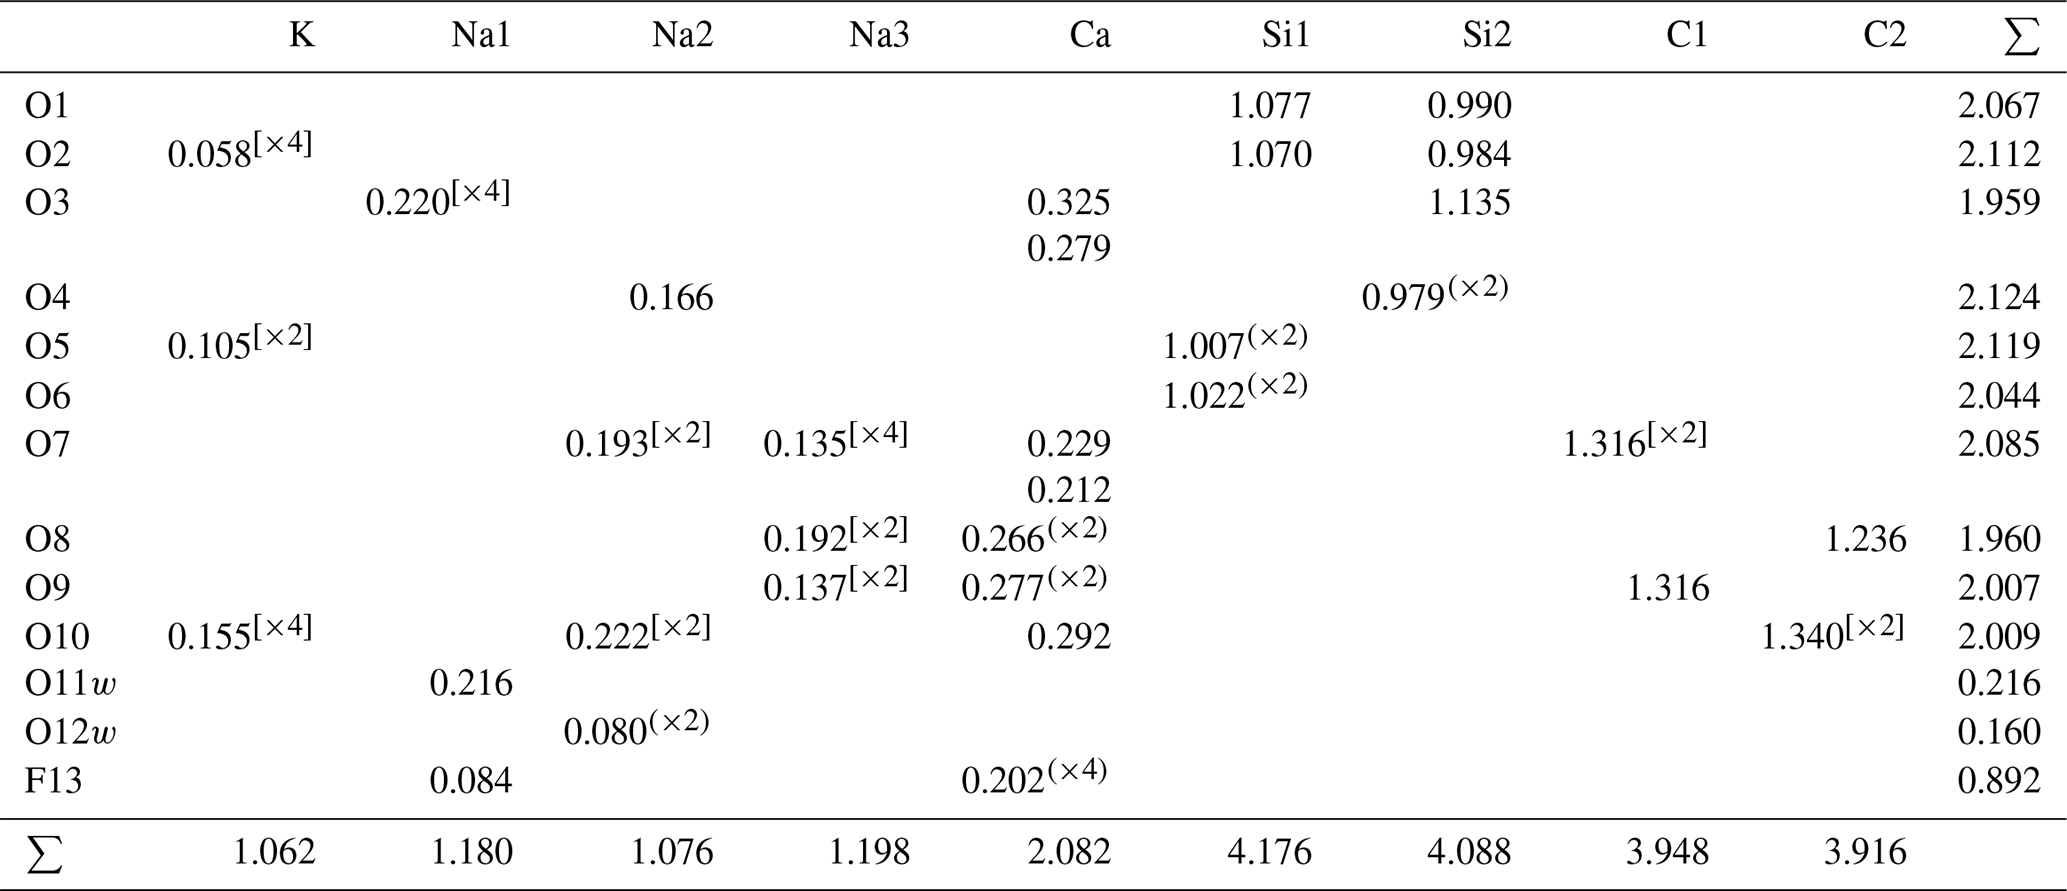
[×2], [×4]: for the calculation of the valence bond sum for cations. (×2), (×4): for the calculation of the valence bond sum for anions.
3.3 TG–DSC investigation
A polycrystalline sample of the mineral was investigated by differential scanning calorimetry (DSC) on a synchronous analysis device STA 449 F1 Jupiter in an argon atmosphere. The sample was heated from 45 to 1500 ∘C at the rate of 5 ∘C min−1. The qualitative and quantitative composition of gaseous thermolysis product was monitored using a 403 C Aëolos quadrupole mass spectrometer. The initial mass was 33.54 mg. The energy of electron impact is 70 eV.
3.4 Infrared spectroscopy
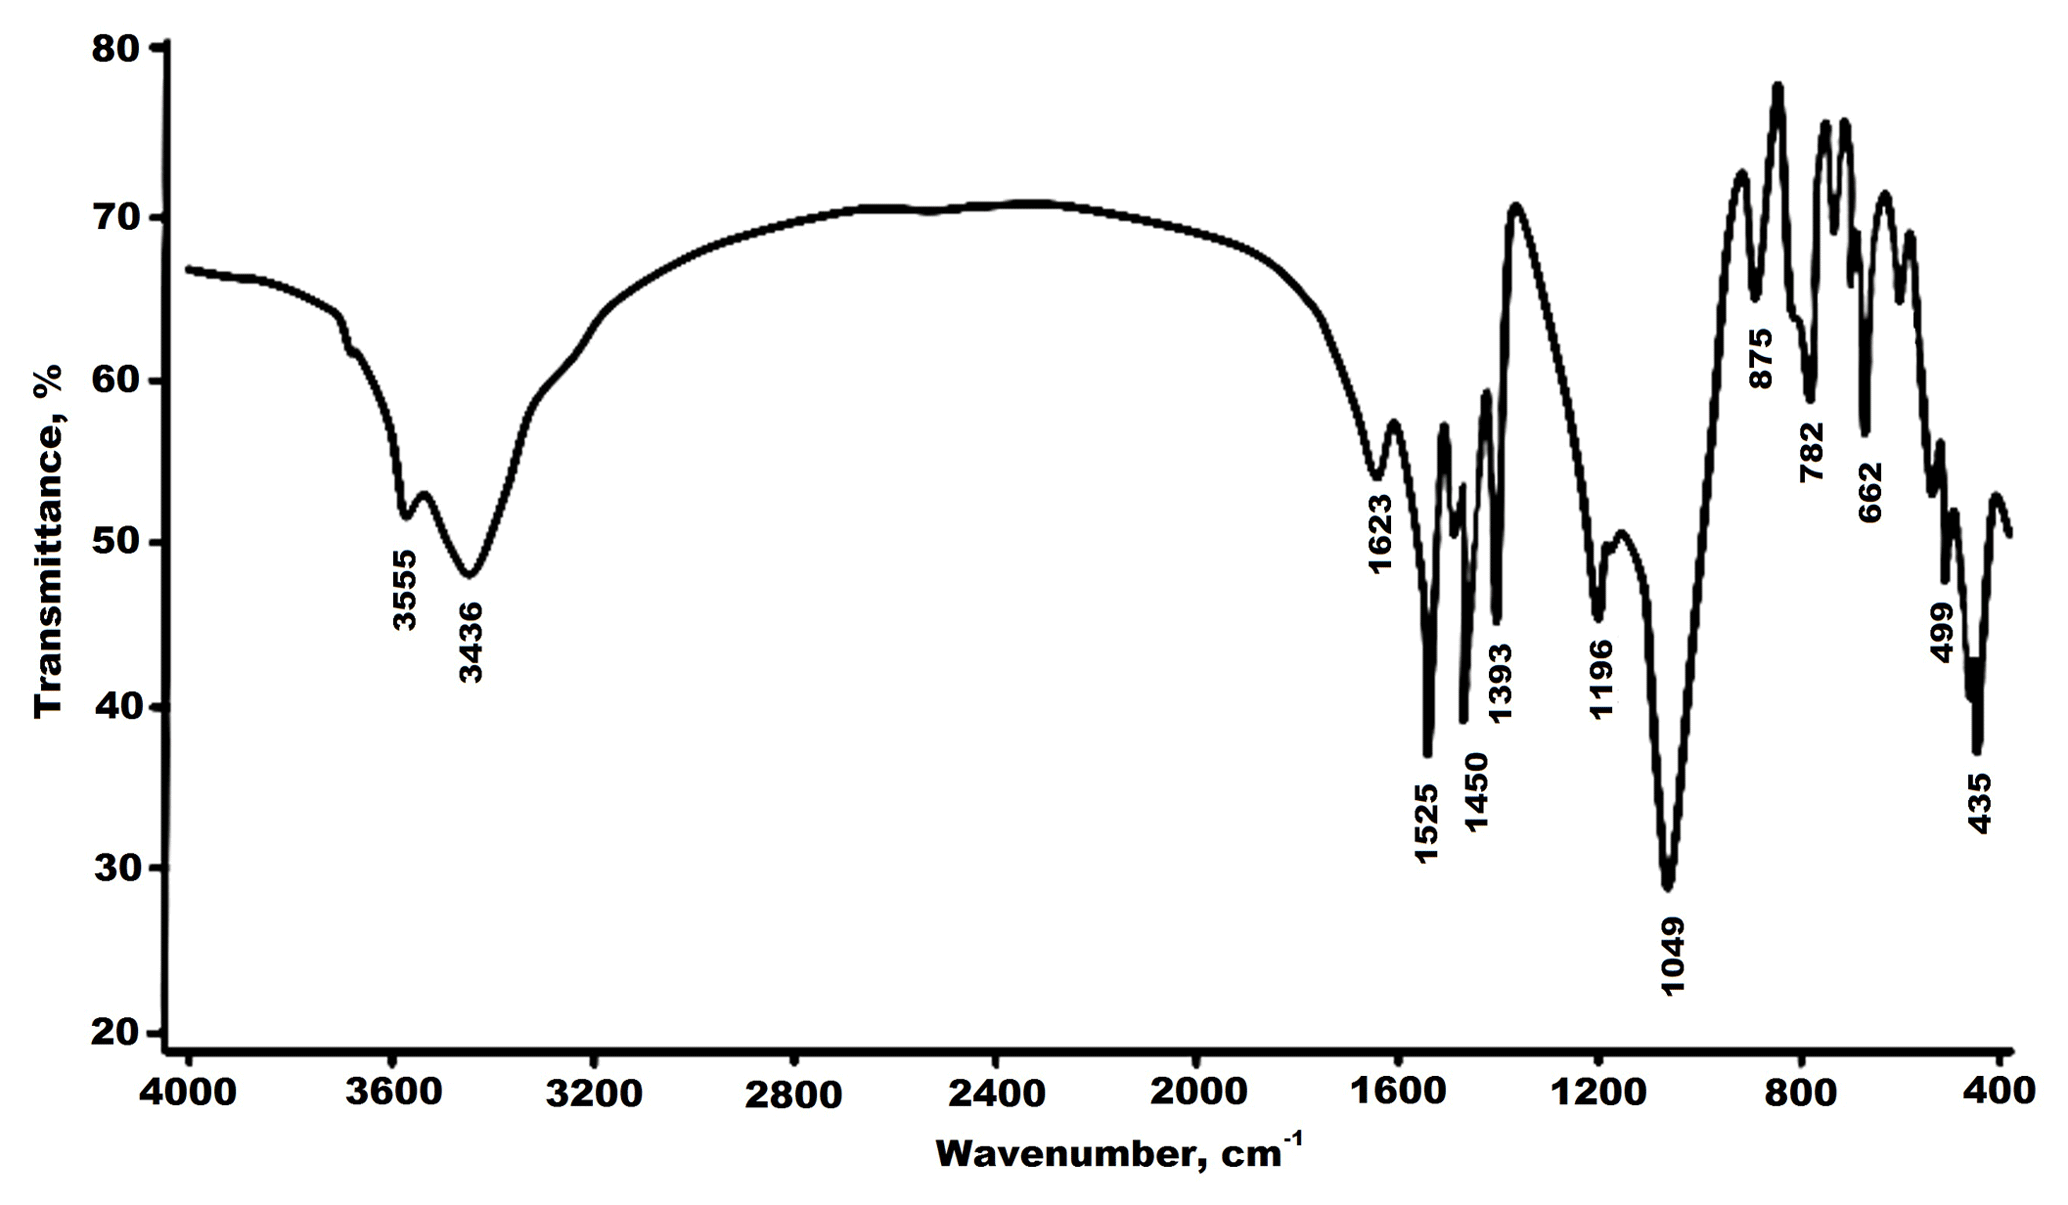
The Fourier transform infrared spectrum of fluorcarletonite powder in a KBr pellet was recorded by a Vertex 70 FTIR Bruker infrared spectrometer and a Varian 3 100ATR/FTIR (RAM II) spectrophotometer. Infrared spectrum was acquired from 4000 to 400 cm−1, as displayed in Fig. 3.
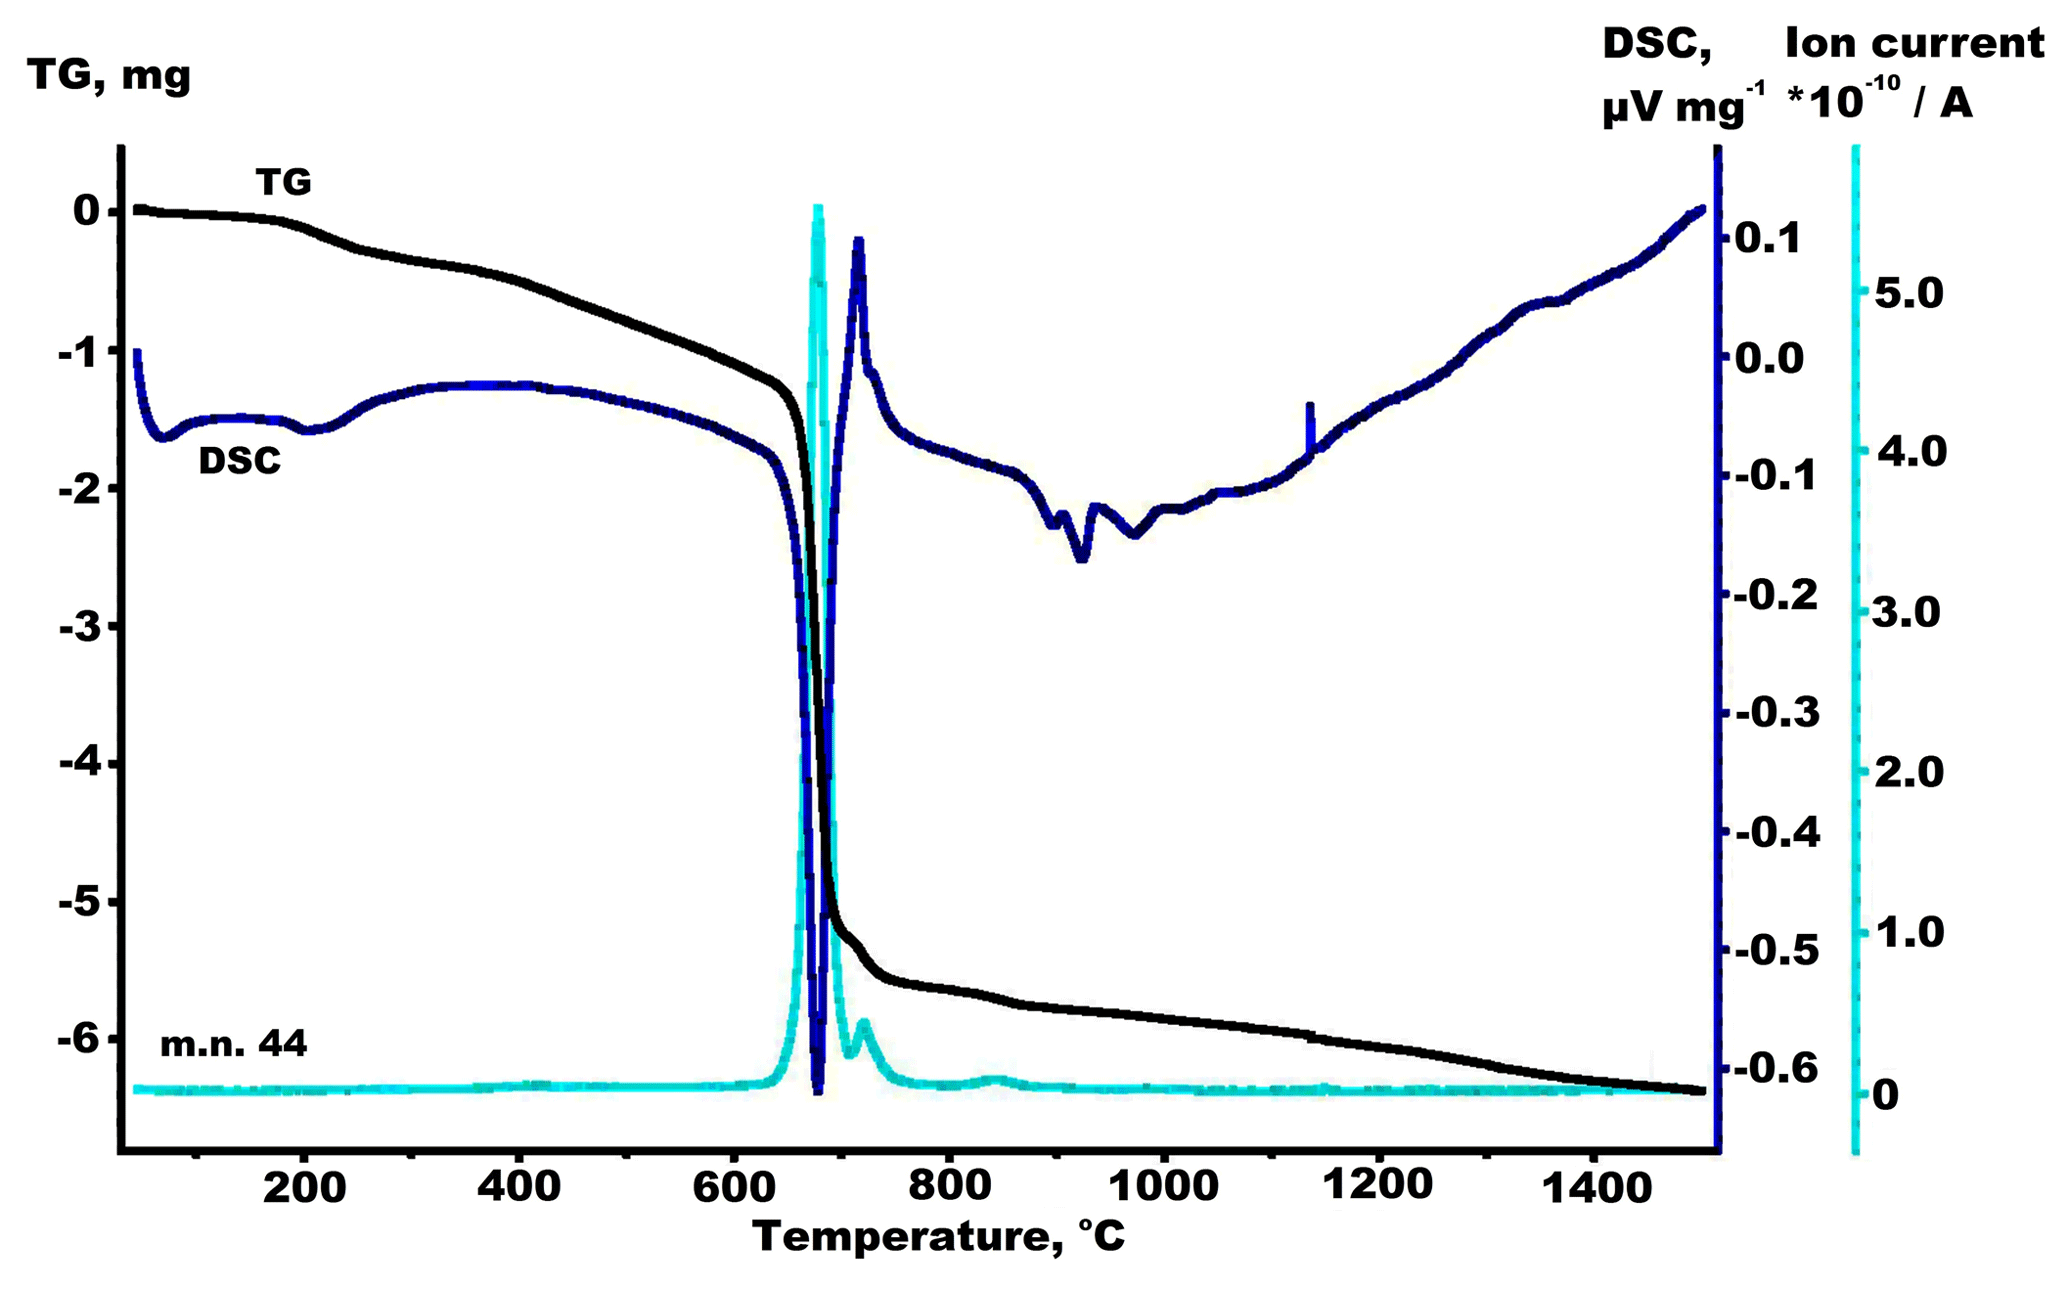
Figure 2Curves of thermal effects (TG, DSC) and mass spectra (dependences of ion current I on temperature T) of gaseous thermolysis products: release of CO2 (m.n. 44) upon sample heating from fluorcarletonite crystal structure.
4.1 Chemical composition
The crystal chemical formula was calculated on the basis of (Si + Al) =8 atoms per formula unit (apfu) and assuming H2O content consistent with the refined occupancies of the O11(w) and O12(w) sites (Table 3). The average formula of the fluorcarletonite is
It is noteworthy that Al is almost absent in the fluorcarletonite compared to the carletonite from the Mont Saint-Hilaire massif (Table 1). In our case, the Ti concentrations in the sample are low. The Canadian mineral was described as nonstoichiometric with the deficiencies in K, Na, Ca, CO3 and F (Chao, 1971, 1972).
Electron microprobe analysis of fluorcarletonite revealed that individual crystals are very inhomogeneous with respect to the fluorine content (from 0.9 wt % to 1.7 wt %) and the average F content in the sample is 1.3 wt % (vs. ∼0.7 wt % in the carletonite from Mont Saint-Hilaire, Chao, 1971). Accordingly, the calculated atomic proportion of F, substituting by the OH group in the crystal structure, for the studied Murun fluorcarletonite ranges from 0.53 to 0.98 apfu compared with 0.41 apfu in the carletonite from Mont Saint-Hilaire (Chao, 1971).
Some of the analyzed areas contain a reduced amount of fluorine. Basically, these are the peripheral zones of crystalline fluorocarletonite aggregates, characterized by the less saturated blue color. Analysis points with F content of 0.17 wt %–0.78 wt %, with an average of 0.54 wt %, were noted. This corresponds to 0.31 fluorine atoms per formula unit, indicating a small content of carletonite, K1.04Na3.84Ca3.97Mg0.01Si7.99Al0.01O18(CO3)3.93 (OH0.69F0.31)⋅nH2O, in the charoitic rock sample.
The mass spectra exhibited the presence of H2O (mass number, m.n., 18), CO2 (m.n. 44) and F (m.n. 19). The endothermic effects at 45–127 and 127–315 ∘C are accompanied by the weight losses of 0.15 % and 1.02 % most likely related to the release of surface and structural H2O, respectively (Fig S1, Supplement S1). The endothermic effect at 630–1134 ∘C accompanied by the weight loss of 14.9 % results from the release of CO2 (Fig. 2). It should be noted that the loss of CO2 in this temperature range shows several endothermic effects, which suggest that the crystal structure contains carbonate ions in different coordination environments. The exothermic effect at 1136–1500 ∘C is accompanied by the weight loss of 1.22 % and is most probably due to the loss of fluorine (Fig. S2, Supplement S1). It is worthy to note that the release of fluorine continues while cooling the sample to about 1450 ∘C (Fig. S3, Supplement S1).
The infrared spectra features found in this study are in agreement with the previous ones reported for carletonite and related minerals of similar chemical composition (Table S4, Supplement S1).
The spectral range from 400 to 1200 cm−1 on Fig. 3 displays overlapping of bands, which can be divided into two sets. The first set of lines observed at 435, 455, 499, 524 and 592 cm−1 may be assigned to the bending Si–O vibration. Two bands at 1049 and 1196 cm−1 can be assigned to the stretching vibrations of the Si–O bonds. The bands at 662, 690, 728, 782 and 875 cm−1 are attributed to the bending vibrations of CO3 groups, whereas the bands observed at 1393, 1450, 1477 and 1525 cm−1 are assigned to the CO3 stretching vibrations.
The bands of H-containing groups occur in the region extending from 4000 to 1500 cm−1. The H2O stretching band is observed at 3436 cm−1, and the band at 1623 cm−1 is assigned to the bending vibration of H2O. Finally, the peak at 3555 cm−1 is attributed to the stretching vibration of hydroxyl groups.
4.2 Crystal structure description
The structural features of fluorcarletonite are reported in Tables 3, 4 and 7; Tables S1 and S2 (Supplement S1); and Figs. 4–5.
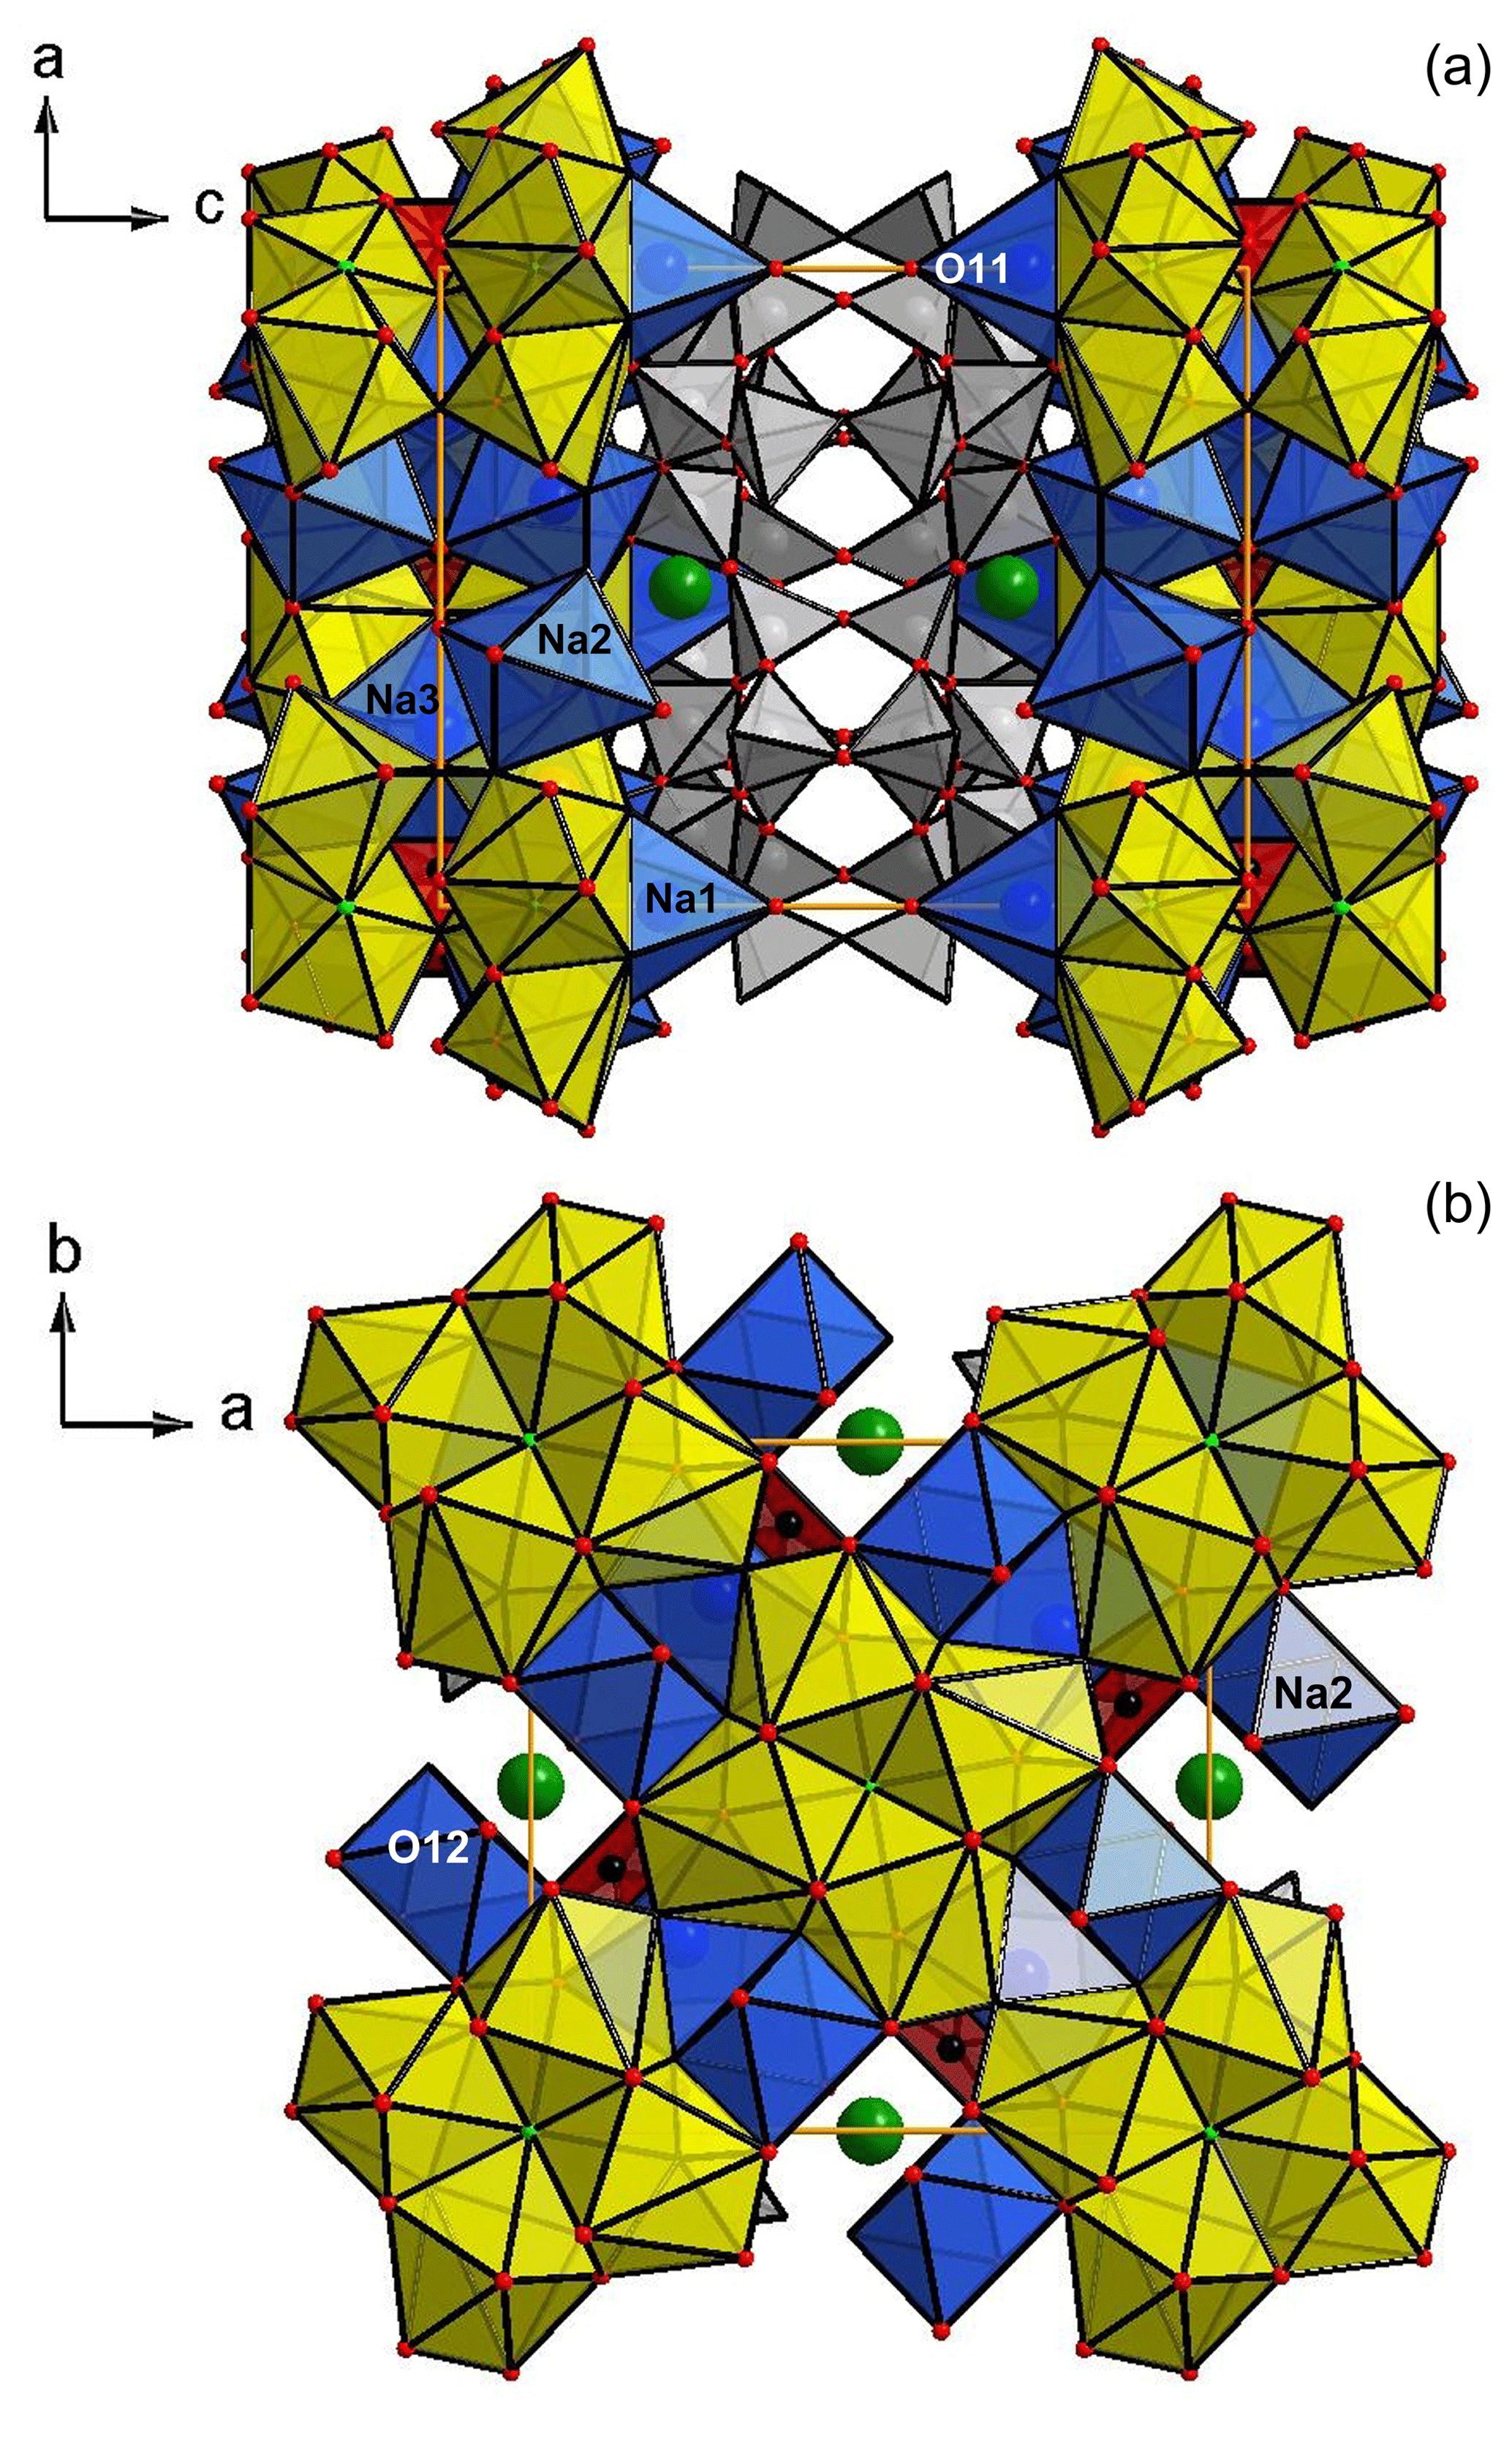
Figure 4Fluorcarletonite crystal structure, as viewed down the b axis (a) and down the c axis (b). Na polyhedra, Ca polyhedra and SiO4 tetrahedra are drawn in blue, yellow and gray, respectively. Potassium atoms are green; CO3 triangles are drawn in red. Figures are made using the DIAMOND program (Bergerhoff et al., 1996).
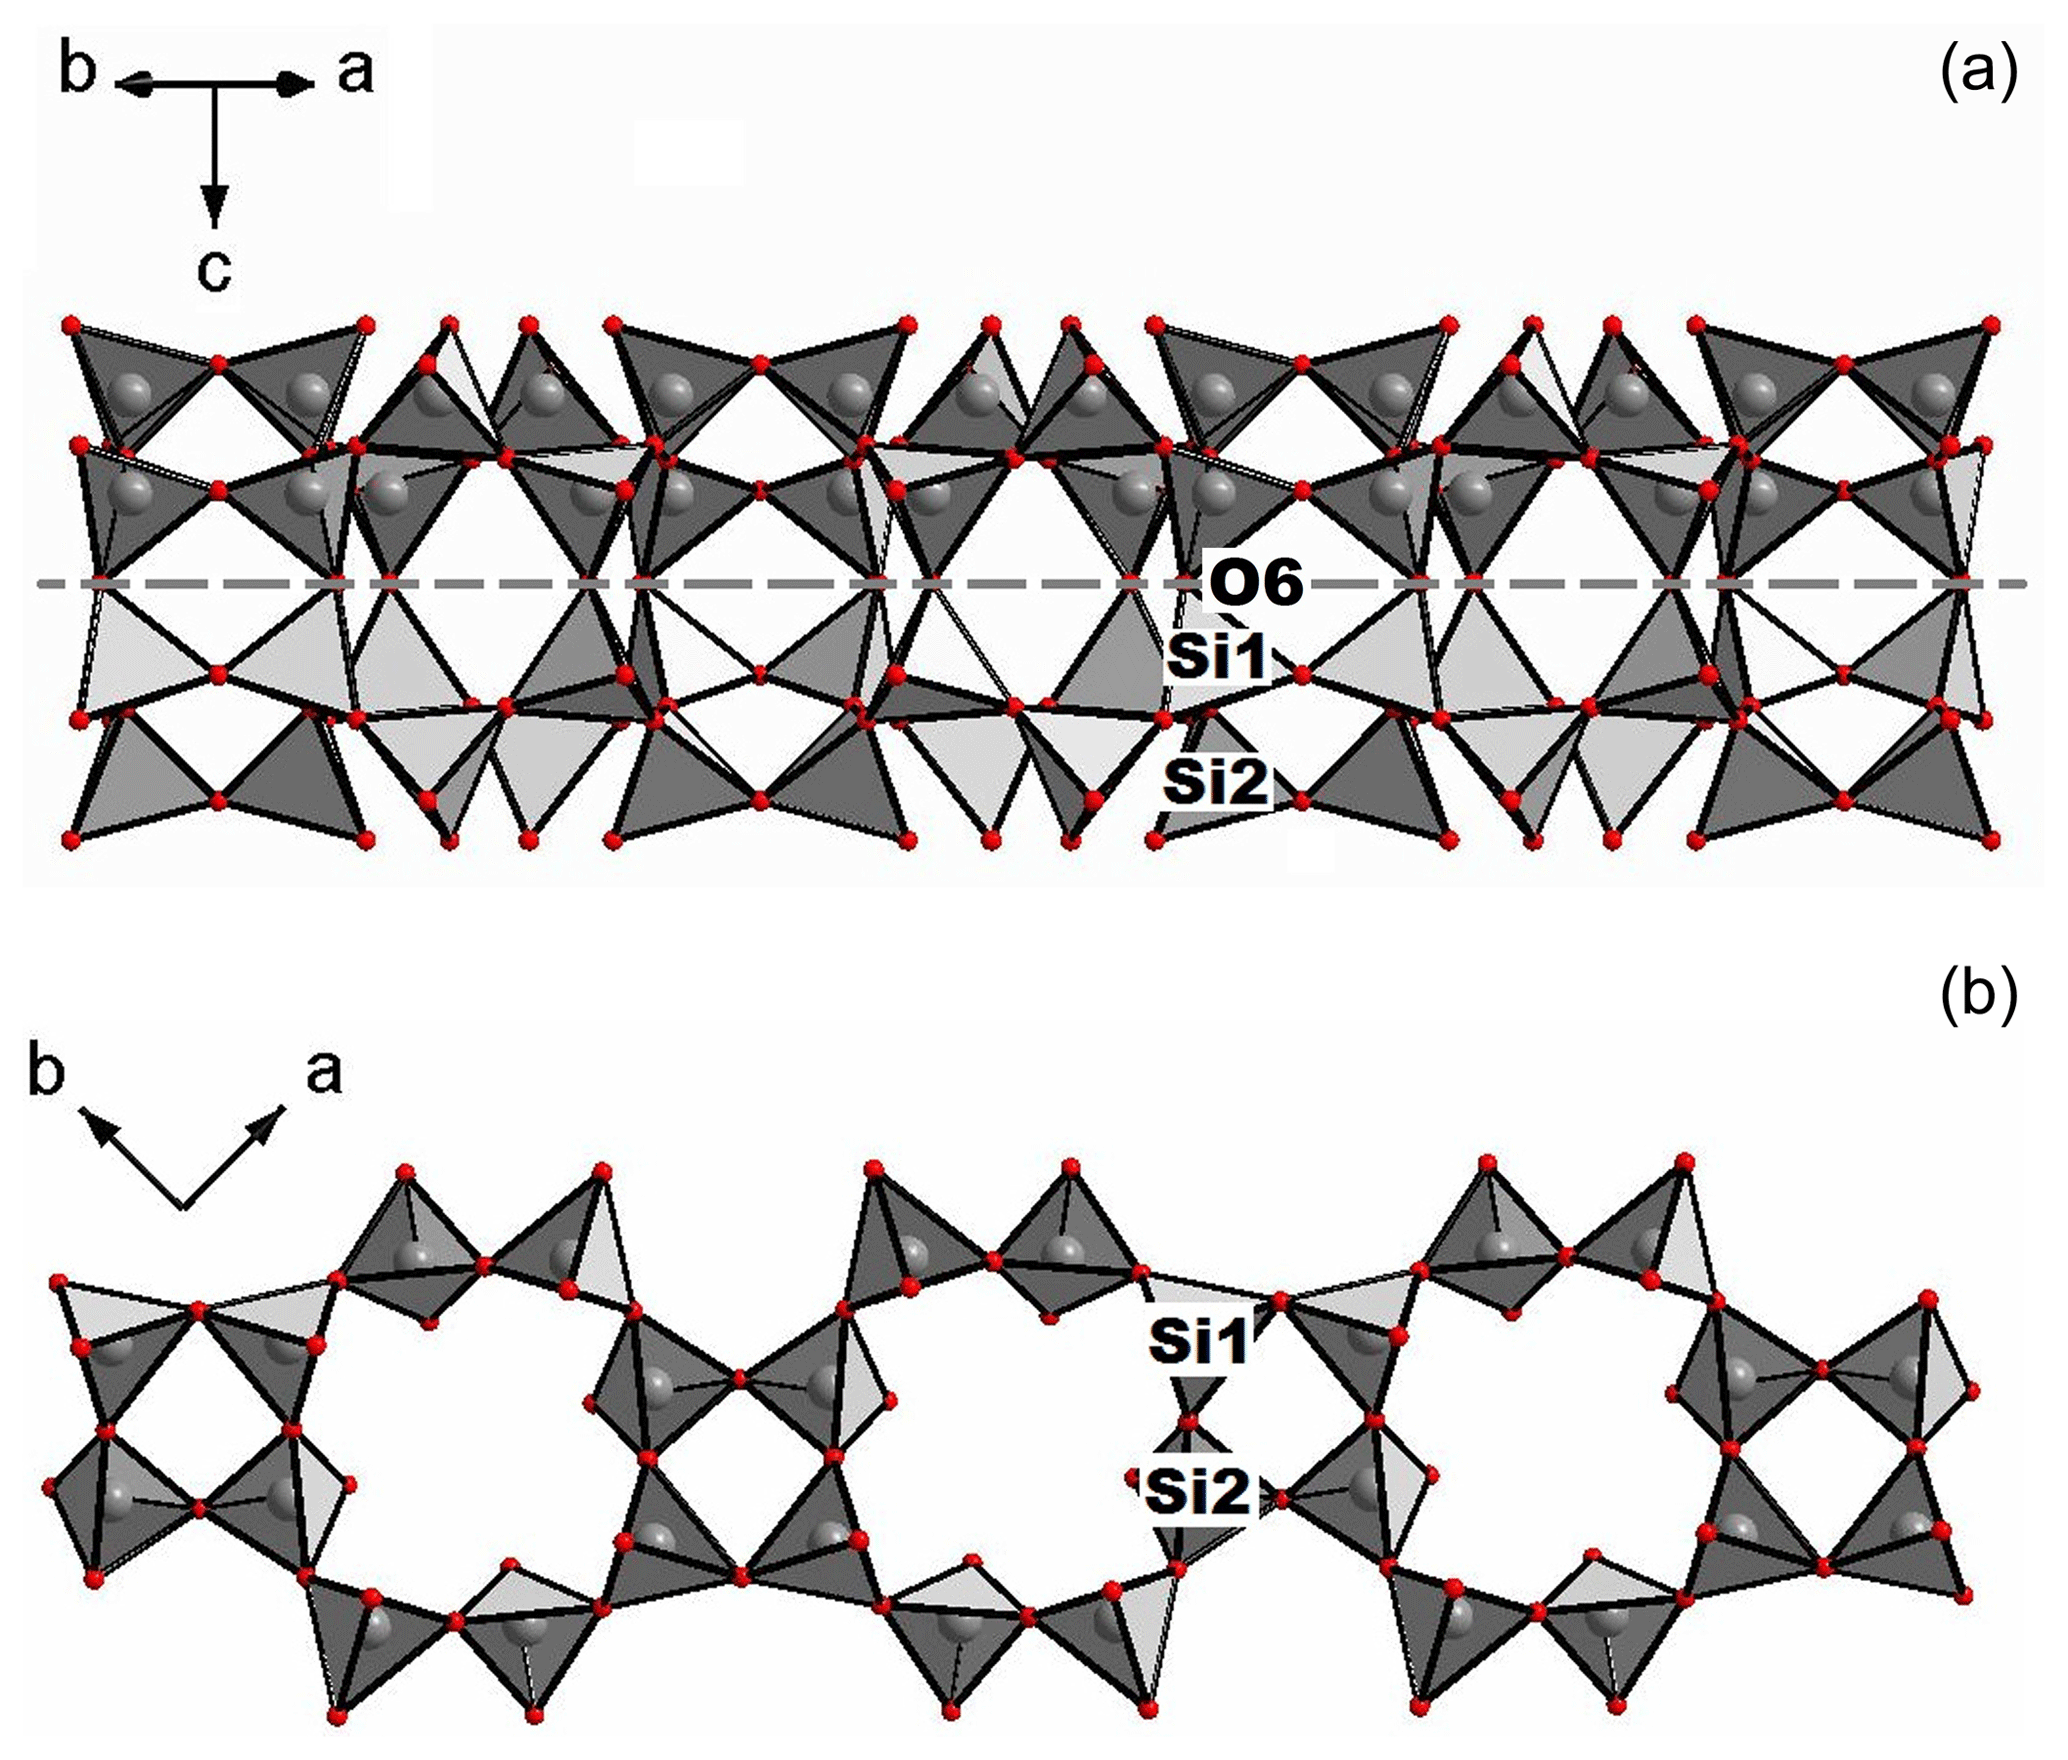
Figure 5Perspective view of the fluorcarletonite crystal structure evidencing the tetrahedral bond linkage: (a) loop-branched sechser double-silicate layer obtained by the condensation of two branched single layers; (b) branched single layer – a component of the fluorcarletonite silicate radical. Figures are made using the DIAMOND program (Bergerhoff et al., 1996).
Figure 4 shows the crystal structure of fluorcarletonite in projection down the b (Fig. 4a) and c axes (Fig. 4b), whereas Fig. 5 displays the details of the crystal structure with the emphasis on the tetrahedral linkage. The crystal structure consists of silicate layers, sheets of Na- and Ca-centered polyhedra, and K+ cations occupying the cavities within the eight-membered silicate rings. Additional H2O molecules are situated within pores of the silicate double layers. Finally, isolated CO3 triangles are linked to the Na- and Ca-centered polyhedra sheets.
It is reasonable to start the description of the crystal structure of fluorcarletonite from silicate layers. According to Liebau (2012), the loop-branched sechser double-silicate layer in carletonite, as well as in fluorcarletonite (Fig. 5a), results from the condensation of two branched single layers (Fig. 5b). The crystal structure of fluorcarletonite and carletonite is closely related to those of delhayelite, K4Na2Ca2[AlSi7O19]F2Cl; hydrodelhayelite, KCa2AlSi7O17(OH)2⋅6H2O (Cannillo et al., 1969; Pekov et al., 2009); rhodesite, KNa2Ca2Si8O19(OH)⋅6H2O (Hesse and Liebau, 1992); macdonaldite, BaCa4Si16O36(OH)2⋅10H2O (Cannillo et al., 1968); and monteregianite-(Y), Na4K2Y2Si16O38⋅10H2O (Ghose et al., 1987) (Table S5, Supplement S1). However, all these silicates have branched dreier double layers [(Si, Al)8O19] of the same topology (Liebau, 2012), whereas fluorcarletonite and carletonite contain [Si8O18] layers. Two independent silicate tetrahedra of the single layer form eight-membered rings connected by four-membered rings with four adjacent eight-membered rings. The two sublayers are linked via sharing a common oxygen atom O6 as indicated in Fig. 5a. The size of the eight-membered rings is 7.178(1)×4.664(1) Å, while that of four-membered rings is 4.027(1)×3.203(1) Å. These values are quite close to those found in other silicates from the Murun charoitites (see, for example, Lacalamita et al., 2017) and silicates with heterogeneous frameworks (see, for example, Mesto et al., 2014). There is a further eight-membered ring with a size of 4.466(1)×4.466(1) Å in the straighter windows and 6.144(1)×6.144(1) Å in the wider ones configured with the equivalent eight-membered ring of the adjacent SiO4 layer. These cages host a H2O group (at the O11 site) that is shared by two Na atoms coordinated with the apex of the smaller window.
For the studied fluorcarletonite crystals, SiO4 tetrahedra are quite regular as confirmed by the average Si–O distances (1.608(1) and 1.617(1) Å; Table S2, Supplement S1). The BLD (bond length distortion: Renner and Lehmann, 1986) values for Si1O4 and Si2O4 tetrahedra are ∼0.67 % and ∼1.24 %, respectively, and the TAV (tetrahedral angle variance, Robinson et al., 1971) values are ∼5.9 and 14.5, respectively (Table 4), which shows that the Si2 site has a slightly greater bond length distortion and angle variance. The calculation of the distortion parameters was also performed with the data for carletonite taken from Chao (1972), exhibiting similar relative variations.
Silicate layers are linked by vertices to the Na1 and Na2 octahedra and Ca polyhedra. The Na3 site is surrounded by eight oxygen atoms belonging to carbonate groups. Two symmetrically independent Na-centered octahedra are geometrically different: (1) the Na2 site has longer average Na–O distances than Na1 (∼2.438(2) Å and 2.386(2) Å, respectively; Table S3, Supplement S1) and, as a consequence, the greater octahedral volume (18.58 Å3 vs. 16.64 Å3, respectively; Table 4); (2) the angle variances for Na1 are greater than those for Na2 (OAVs, octahedral angle variances, Robinson et al., 1971, are 209.772 and 86.522 for Na1 and Na2, respectively; Table 4); (3) the BLD for Na2 is greater than that for Na1 (4.513 and 3.685, respectively; Table 4). Concerning the 8-coordinated Na3 and Ca polyhedra, the Na–O and Ca–O distances are 2.498(1) Å and 2.455(1) Å, respectively (Table S3, Supplement S1).
The K+ ions are located in a fully occupied 10-coordinated site within the eight-membered ring of the silicate anion with the average K–O bond length of 2.978(1) Å (Table S3, Supplement S1).
Two independent CO3 groups in the crystal structure are linked to the Na2, Na3 and Ca polyhedra. The C2O3 carbonate group is also bonded to K+ cations. The observed C–O, O–O distances and O–C–O angles of CO3 triangle (Table S3, Supplement S1) are similar to those reported by Chao (1972) for carletonite.
The O atoms of the H2O groups occupy the O11(w) and O12(w) sites and coordinate the Na1 and Na2 sites, respectively (Fig. 4a and b). According to the structure refinement, the O11(w) site is almost completely occupied (0.840(8); Table 3), while the O12(w) site has the occupancy of ∼50 % (Table 3; the distances between two neighboring O12(w) positions is 2.361(3) Å). We could not locate the H sites from the analysis the difference-Fourier maps, presumably due to the disorder and partial occupancy of the H2O sites.
Finally, in fluorcarletonite samples the interatomic distances are very close to those observed for carletonite from the Mont Saint-Hilaire massif as reported by Chao (1972) (see Tables S1 and S2, Supplement S1). The same applies to the distortion parameters for the fluorcarletonite and carletonite samples (Table 4).
Table 5 yields the results of a bond-valence analysis for the sample studied. For calculation of the bond-valence sums (BVSs), the parameters suggested by Brese and O'Keeffe (1991) and Gagnè and Hawthorne (2015) have been used. The BVSs are satisfactory or in some cases somewhat higher than expected, taking into account the absence of contributions from the H sites.
The present work provides the results of detailed crystal chemical investigations of fluorcarletonite, a new mineral from the Murun massif. The investigated sample was found in the unique charoitic rocks, where fluorcarletonite associates with pyroxene, fluorapatite, microcline, pectolite, fluorapophyllite-(K), charoite, quartz, carbonate, baryte, wollastonite, galena, idaite, chalcocite, digenite, native copper and covellite, whereas isostructural carletonite from nepheline syenites of Mont Saint-Hilaire coexists with pectolite, arfvedsonite, quartz, microcline, albite, fluorapophyllite-(K), fluorite, ancylite-(Ce) and leifite. The empirical formula of the fluorcarletonite is K1.04Na3.89Ca3.87Ti0.01Si7.99Al0.01O18(CO3)3.86 (F0.72OH0.28)⋅1.11H2O. The H2O, F and CO3 contents were confirmed by TG–DSC investigation, IR spectroscopy and structural refinement. By comparison, carletonite from Mont Saint-Hilaire has the average chemical formula K0.74Na3.56(Ca3.74Mg0.03)Si7.89Al0.11O18(CO3)3.65 F0.41⋅2.05H2O (Chao, 1971). The F site in the crystal structure is occupied by 0.59 (OH)− and 0.41 F− (OH > F). It follows from this that the correct idealized mineral formula of the carletonite mineral should be KNa4Ca4Si8O18(CO3)4(OH)• H2O. The idealized formula of fluorcarletonite is KNa4Ca4Si8O18(CO3)4F• H2O. However, on the Murun, as well as on the Mont Saint-Hilaire, the presence of a pure fluorine or hydroxyl end-member has not yet been noted.
On the Murun massif, there are zonal grains with different contents of F− and OH−. Increased fluorine (in the range from 0.87 wt % to 1.72 wt %) is noted in areas with a more saturated blue color and is confined mainly to the central part of the zonal grains (more than 6 mm in size), whereas on the periphery of grains, as well as in small grains with a pale-blue tint, areas with a fluorine content in the range from 0.17 wt % to 0.78 wt % prevail. This corresponds to the chemical composition of carletonite. Presumably, the decrease in fluorine content from the central parts to the periphery reflects the environmental evolution during the mineral formation, namely, a decrease in fluorine concentrations during crystallization. In conclusion, the possibility of the presence of fluorcarletonite in the rocks of the Mont Saint-Hilaire massif (Canada) is not excluded.
Data are available within the article and its Supplement. Additional data are available on request from the authors.
The supplement related to this article is available online at: https://doi.org/10.5194/ejm-32-137-2020-supplement.
EK wrote the paper, obtained and processed X-ray diffraction data, carried out the crystal structure analysis and processed IR spectroscopic data. TR carried out the optical petrographic and mineragraphic studies. EK and TR processed the electron microprobe data. LS and IS obtained the electron microprobe and IR spectroscopic data, respectively. MM prepared the samples.
The authors declare that they have no conflict of interest.
The authors are grateful to the management of the Charoite Ltd, Sergey Slepnyev and Andrey Romanchenko, for the sample provided for study. The authors thank Aleksandr Kozlov (Melentiev Energy System Institute SB RAS, Irkutsk, Russia) for his assistance with the DSC–TG experiment. Thanks are due to Tatiana Bounaeva, Fernando Cámara and the reviewers, who improved the paper. Particularly warm thanks are expressed to Igor Pekov and Sergey Krivovichev for their advice and invaluable help in describing the new mineral.
The study was performed using the equipment at the Center for Collective Use (“Center for isotopic-geochemical investigations” at the Vinogradov Institute of Geochemistry SB RAS and “Baikal analytical center for collective use” at the Favorsky Irkutsk Institute of Chemistry SB RAS) of the Irkutsk Scientific Center, Siberian Branch of the Russian Academy of Sciences.
This research has been supported by the Grant of the President of the Russian Federation (grant no. MK-936.2019.5). DSC–TG experiments have been supported by the grant of the Russian Foundation for Basic Research funding and the Government of the Irkutsk region (grant no. 17-45-388067 p_a).
This paper was edited by Sergey Krivovichev and reviewed by Fernando Cámara and Taras Panikorovskii.
Bergerhoff, G., Berndt, M., and Brandenburg, K.: Evaluation of crystallographic data with the program DIAMOND, J. Res. Natl. Inst. Stan., 101, 221–225, https://doi.org/10.6028/jres.101.023, 1996.
Betteridge, P. W., Carruthers, J. R., Cooper, R. I., Prout, K., and Watkin, D. J.: Crystals version 12: software for guided crystal structure analysis, J. Appl. Crystallogr., 36, 1487, https://doi.org/10.1107/S0021889803021800, 2003.
Brese, N. E. and O'Keeffe, M.: Bond-valence parameters for solid, Acta Crystallogr., B47, 192–197, https://doi.org/10.1107/S0108768190011041, 1991.
Bruker: APEX2, Bruker AXS Inc., Madison, Wisconsin, USA, 2003.
Bruker: SAINT, Bruker AXS Inc., Madison, Wisconsin, USA, 2007.
Bruker: Topas V4: General profile and structure analysis software for powder diffraction data, Bruker AXS Inc., Karlsruhe, Germany, 2008.
Bruker: SADABS, Bruker AXS Inc., Madison, Wisconsin, USA, 2009.
Cannillo, E., Rossi, G., and Ungaretti, L.: The crystal structure of macdonaldite, Locality Fresno County, California, USA, Atti della Accademia Nazionale dei Lincei, Rend. Classe Sci. Fis. Mat. Nat., 45, 399–414, 1968.
Cannillo, E., Rossi, G., and Ungaretti, L.: The crystal structure of delhayelite, Rendiconti della SIMP, 26, 63–75, 1969.
Chao, G. Y.: Carletonite, KNa4Ca4Si8O18(CO3)4(F,OH)⋅H2O, a new mineral from Mount St. Hilaire, Quebec, Am. Mineral., 56, 1855–1865, 1971.
Chao, G. Y.: The crystal structure of carletonite, KNa4Ca4Si8O18(CO3)4(F,OH)⋅H2O, a double-sheet silicate, Am. Mineral., 57, 765–778, 1972.
Gagnè, O. C. and Hawthorne, F. C.: Comprehensive derivation of bond-valence parameters for ion pairs involving oxygen, Acta Crystallogr., B71, 562–578, https://doi.org/10.1107/S2052520615016297, 2015.
Ghose, S., Gupta, P. K. S., and Campana, C. F.: Symmetry and crystal structure of montregianite, Na4K2Y2Si16O38⋅10H2O, a double-sheet silicate with zeolitic properties, Am. Mineral., 72, 365–374, 1987.
Hesse, K.-F. and Liebau F.: Crystal structure of rhodesite, lB,3,2 [Si8O19]⋅(6-z)H2O, from three localities and its relation to other silicates with drier double layer, Z. Kristallogr., 199, 25–48, https://doi.org/10.1524/zkri.1992.199.14.25, 1992.
Lacalamita, M., Mesto, E., Kaneva, E., Scordari, F., Pedrazzi, G., and Vladykin, N., Schingaro E.: Structure refinement and crystal chemistry of tokkoite and tinaksite from the Murun massif (Russia), Mineral. Mag., 81, 251–272, https://doi.org/10.1180/minmag.2016.080.094, 2017.
Liebau, F.: Structural chemistry of silicates: structure, bonding and classification, Springer-Verlag, New York, 2012.
Mesto, E., Kaneva, E., Schingaro, E., Vladykin, N., Lacalamita, M., and Scordari, F.: Armstrongite from Khan Bogdo (Mongolia): crystal structure determination and implications for zeolite-like cation exchange properties, Am. Mineral., 99, 2424–2432, https://doi.org/10.2138/am-2014-4906, 2014.
Momma, K. and Izumi, F.: VESTA 3 for three-dimensional visualization of crystal, volumetric and morphology data, J. Appl. Crystallogr., 44, 1272–1276, https://doi.org/10.1107/S0021889811038970, 2011.
Pekov, I. V., Zubkova, N. V., Chukanov, N. V., Sharygin, V. V., and Pushcharovsky, D. Yu.: Crystal chemistry of delhayelite and hydrodelhayelite, Dokl. Earth Sci., 428, 1216–1221, https://doi.org/10.1134/S1028334X09070393, 2009.
Pohwat, P. W. and Cook, R. B.: Carletonite, Mont Saint-Hilaire, La Vallèe-du-Richelieu RCM, Montèrègie, Quèbec, Canada, Rocks and Minerals, 91, 48–51, 2016.
Renner, B. and Lehmann, G.: Correlation of angular and bond length distortion in TO4 units in crystals, Z. Kristallogr., 175, 43–59, https://doi.org/10.1524/zkri.1986.175.14.43, 1986.
Robinson, K., Gibbs, G. V., and Ribbe, P. H.: Quadratic elongation: a quantitative measure of distortion in coordination polyhedral, Science, 172, 567–570, https://doi.org/10.1126/science.172.3983.567, 1971.
Vladykin, N. V.: Genesis and crystallization of ultramafic alkaline carbonatite magmas of Siberia: ore potential, mantle sources, and relationship with plume activity, Russ. Geol. Geophys., 57, 889–905, https://doi.org/10.1016/j.rgg.2015.09.014, 2016.
Wang, Y., He, H., Ivanov, A. V., Zhu, R., and Lo, C.: Age and origin of charoitite, Malyi Murun massif, Siberia, Russia, Int. Geol. Rev., 56, 1007–1019, https://doi.org/10.1080/00206814.2014.914860, 2014.